Foreign Cotton Area and Production for 2006/07 Expected to Increase Following Higher World Cotton Prices 2005/06
Many factors influence farmers' decisions at planting time. Cotton prices, prices of competing crops and government programs play an important role in determining area planted to cotton. The Cotlook A-Index provides a good indication of the direction of world prices. The A-Index is an average of the five lowest-priced, out of 18 comparable world cotton varieties, offered for sale from cotton exporting countries, basis C/F Far Eastern ports*. Foreign cotton area and the prior years' A-Index are positively correlated. The graph depicts this correlation.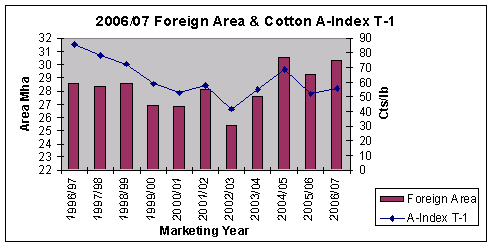
During the first 6 months of the current marketing year, the A-index averaged just below 56 cents per pound, approximately 7 percent above last years' average price. The higher world price this year indicates higher foreign area in 2006/07.
In addition to prices, farmers take other factors into consideration when making planting decisions, such as government policies, available crop alternatives, reservoir levels for irrigated crops, and planting-time weather for rain-fed crops. The Government of Uzbekistan, for example, continues to determine planted area and production targets, thus the price response of these farmers is limited. Turkey and Australia's cotton crops are mostly irrigated, therefore reservoir levels are critical in determining cotton area planted. Since planting time in southern hemisphere countries differs from that of northern hemisphere producers, planting decisions are made based on a different set of conditions than those that exist for northern hemisphere countries. For example, Brazil's cotton industry contracted in 2005 due to low prices, an appreciating currency, increased input costs, and lack of available credit. Accounting for these factors, preliminary indications suggest that foreign cotton area will increase to 30.2 million hectares, with production forecast at 94 to 98 million bales in 2006/07, compared with an area of 29.3 million hectares and production of 90.0 million bales in 2005/06.
*Cotlook changed the delivery location of the quotes used to calculate the A Index in 2003. Prior to this date, the A Index referred to quotes based on CIF Northern Europe.
To derive this projection, USDA reviewed initial producer prospects in countries accounting for over 80 percent of foreign area.
The estimates in this report and the following table reflect official USDA estimates as of February 2006. The table below presents the 2006/07 forecast with the most recent 5-year average and an 11-year history of foreign area, yield, and production.
Foreign Cotton Area, Yield, and Production |
Marketing Years |
Harvested Area (1,000 Ha.) |
Yield (Kg./Ha.) |
*Production (1,000 bales) |
1995/96 |
29,499 |
560 |
75,824 |
1996/97 |
28,515 |
543 |
71,087 |
1997/98 |
28,353 |
564 |
73,442 |
1998/99 |
28,569 |
546 |
71,584 |
1999/00 |
26,808 |
575 |
70,752 |
2000/01 |
26,739 |
584 |
71,663 |
2001/02 |
28,134 |
607 |
78,449 |
2002/03 |
25,424 |
608 |
71,043 |
2003/04 |
27,356 |
613 |
77,007 |
2004/05 |
30,536 |
693 |
97,126 |
Estimate
2005/06 |
29,273 |
670 |
90,032 |
|
5-year Avg. |
28,145 |
640 |
82,731 |
|
Forecast 2006/07 |
30,200 |
678-707 |
94,000-98,000 |
*480-pound bales |
|