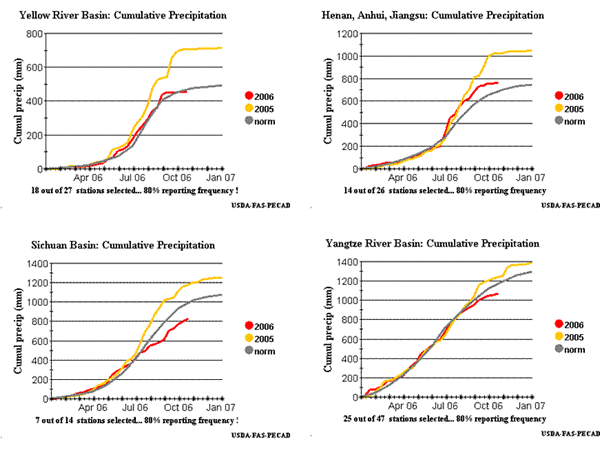
Crop Explorer - 2006 rainfall graphs by region compared to 2005. Although all areas showed some dryness after August, the rainfall totals for the crop year are close to normal. In 2005, unusually heavy rain from July through October caused quality problems and fieldwork delays.
|

