Ethiopia 2008 Crop Assessment Travel Report
USDA’s Office of Global Analysis (OGA) of the Foreign Agricultural Service (FAS) performed a mid-season crop assessment and spatial model validation survey in Ethiopia from October 8-17, 2008, with personnel from USAID's FEWS-NET project, the United Nation's Word Food Program (WFP), and the European Commission's Monitoring of Agriculture with Remote Sensing (MARS) program of the Joint Research Centre (JRC). This was the first known crop assessment tour between personnel from USDA/FAS, FEWS-NET, WFP and MARS.
The crop assessment route covered a northern and southern route from Addis Ababa, as shown in Figure 1. Field observations, digital photos, spatial model products, and interviews with farmers helped to determine current crop conditions and possible end-of-season yields. Thirty-eight farmers were randomly interviewed along the route and over 2700 digital photos showing crop conditions and landcover were taken. A GPS track data was also recorded every 30-seconds and the GPS track data was used to georeference the digital photos by utilizing the GPS-Photo Link software by GeoSpatial Experts.
Figure 1. Ethiopia 2008 Crop Assessment Route
The two main crop seasons in Ethiopia are the belg and meher seasons which receive rainfall from February to June and from June to October, respectively. The meher crop season is the main season and produces 90-95 percent of the nation’s total cereals output, and the belg harvest provides the remaining 5-10 percent of cereal output. For the belg harvest, corn accounts from one-third to nearly one-half of the belg’s cereal production and the remaining belg output comprises of mostly short-cycle wheat, barley, and teff.
In some highland regions, the belg and meher seasons merge into one extended growing period whereby both long-cycle grains (such as sorghum and corn) and short- cycle small grains (such as wheat, barley, and teff) can be grown. To avoid confusion between these two growing seasons, the Ethiopian belg crop season is officially defined as any crop harvested between March and August, while the meher crop season is defined as any crop harvested between September and February.
For this year's belg harvest which ended on September 1st, all farmers in the north reported no belg crops were harvested due to the failure of the belg rains. These farmer field reports helped to confirm that this year's Water Requirement Satisfaction Index (WRSI) product for the belg season properly recorded the belg failure in the north, as shown in Figure 2 below.
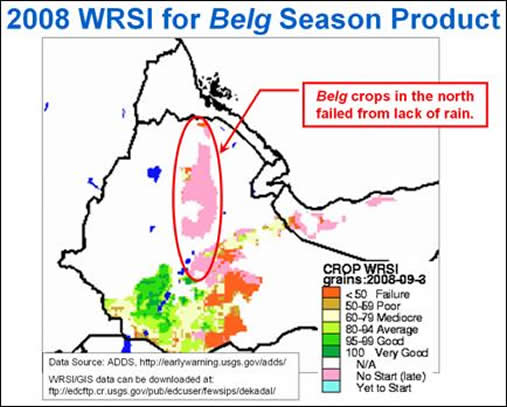
Figure 2. Belg crop failure in the north for September, 2008.
For this year's meher season, long-cycle corn and sorghum crops were observed to range from flowering to grain filling stages and these crops were ready for harvest in the southern lowland regions near Awasa. Short-cycle meher crops such as teff, wheat, and barley were planted during June/July and most of these fields were in the grain filling stages, with harvest beginning in some fields.
Rains were reported to arrive timely in most regions, but onset of rains were reported to be late by nearly one month in Wollo, southern Tigray and east Shewa zones. In addition, farmers in the north were concerned by the early cessation of the rains from early September, 2008, as shown in Figure 3. The soil moisture reserves during mid-October were depleted in these regions where it had not rained for nearly one month and crops were in the critical grain-filling stages. The November rains were above-average in the northern region but these rains may have been too late to save the crops from October's dryness.
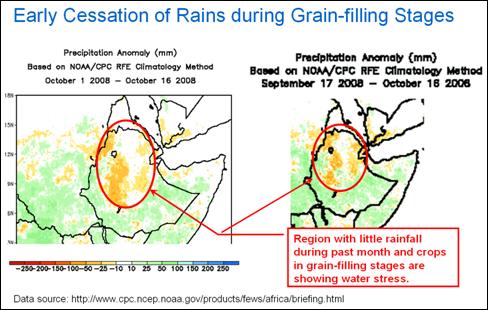
Figure 3. Less than average rainfall during the past 30-days.
In general, meher harvest prospects for sorghum and corn are expected to be below last year’s record crop because the combination of belg rain failures and early cessation of meher rains shortened the growing season for these long-cycle crops. In addition, expected yields for the short cycle small grain crops will be below last year due to September/October dryness and lower fertilizer applications caused by high fertilizer prices.
In the Arsi and Bale region in eastern Oromiya, most farmers reported that fertilizer supplies were readily available this year but fertilizers were expensive and many farmers could not afford to apply optimal fertilizer levels or even apply the same fertilizer amounts as they applied last year. Even though rains have been favorable so far in the Bale/Arsi regions, final yields are expected to be 10-20 percent less than last year due to reduction in fertilizer application amounts caused by exorbitant fertilizer prices. The Bale and Arsi farmers are greatly impacted by the rise in fertilizer prices because these remote regions do not have tarmac roads and fertilizers are more expensive to obtain due to higher transportation costs.
The regions with the poorest crop conditions were properly monitored by the forecast WRSI product. These regions were Wollo, southern Tigray, east Shewa lowlands, and Arsi lowlands north of Asela, as shown in Figure 4. In general, long-cycle corn and sorghum crops had failed or were close to failure in these regions, but crop conditions for short-cycle crops such as wheat and teff were in much better condition than corn or sorghum.
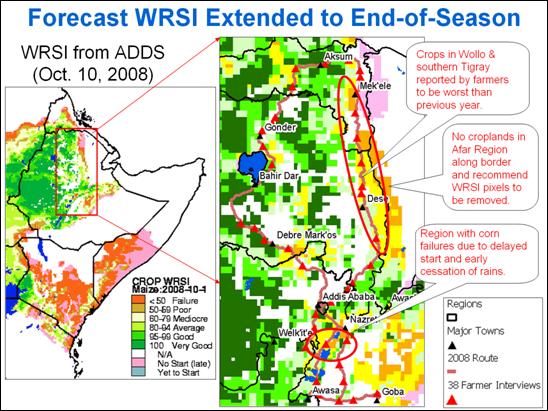
Figure 4. Forecast WRSI Extended to End of 2008 Season.
GLAM Tools for Monitoring Crop Area and Yield
The GLAM (Global Agriculture Monitoring) project, which is funded by USDA/FAS/OGA and NASA, utilizes 250-meter MODIS-NDVI time-series data for relative crop yield analysis and utilizes 55-meter AWiFS imagery for crop area analysis (refer to Figure 5).
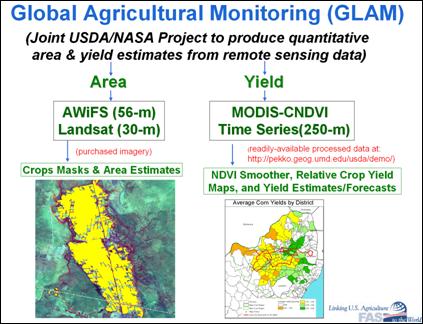
Figure 5. Satellite imagery utilized by GLAM to monitor crop area and yields.
The MODIS-NDVI time series profiles for several regions are shown in Figure 6. These profiles compare the current year to the previous year and to the 7-year average from 2001-2007. These MODIS-NDVI profiles indicate that the Tigray region had the poorest performance, while farmer reports and ground crop conditions in mid-October also confirmed these results.
Figure 6. MODIS-NDVI Time Series for Several Regions within Ethiopia
As part of the Global Agricultural Monitoring (GLAM) project between NASA and USDA/FAS/OGA, the Geospatial Data Analysis Corporation (or GDA Corp) has developed automated crop masking algorithms for rapid processing of 55-meter AWiFS satellite imagery received. The automated crop masking algorithms developed by GDA produce five major data layers within 72-hours after satellite data reception. These five data layers include the following:
- Clouds and shadows removal
- Surface reflectance correction for mosaics and NDVI comparisons
- NDVI/NDWI calculations
- Water layer for flood analysis
- Dominate crop mask for crop area calculations
For the 2008 crop season, USDA/FAS placed an AWiFS imagery order to receive all AWiFS images over Ethiopia with 50 percent or less clouds from September and October, 2008. Ten images were received during the month of September and the five best “cloud-free” images during September were processed by GDA to produce wheat and corn masks for Ethiopia. These crop masks were delivered to USDA/FAS at the beginning of October and were evaluated during the crop assessment survey.
Figure 7 illustrates the wheat and corn masks that were generated from September’s AWiFS imagery.
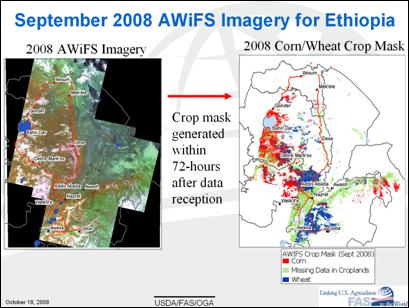
Figure 7. Automated corn and wheat masks generated from
AWiFS data collected over Ethiopia during September, 2008.
For the most part, the automated crop masks properly classified the respective croplands, but the GeoCover LC product did not properly classify cropland regions in the northern regions of Tigray and Amhara regions. It was later discovered that the cropland layer from the Ethiopia Woody Biomass product is better than the GeoCover LC product, and the Woody Biomass cropland layer was used in November to re-process the corn and wheat masks from the best “cloud-free” AWiFS imagery received during October 2008.
Conclusions
Field observations, digital photos, spatial model products, and interviews with farmers helped to determine crop conditions during the 2008 meher growing season in Ethiopia and to evaluate spatial model performance.
The crop conditions for the 2008 crop season are summarized as follows:
- Belg crops failed in the north due to failed belg rains.
- For many northern zones, meher crop yields are expected to be below last year’s record crop, due to early cessation of meher rains from September to October. Soil moisture reserves were depleted in mid-October and crops were under water stress while in the grain-filling stages. The November rains were above-average in the north but these rains may have been too late to save the crops from October's dryness.
- Meher crop yields are expected to be worse than last year for Wollo, southern Tigray, and eastern Shewa zones.
- Yields in the Arsi/Bale region of eastern Oromiya could be reduced by 10-20 percent compared to last year because most Arsi/Bale farmers applied less fertilizers compared to last year due to exorbitant fertilizer costs.
Other Related Links and Images
USDA's PSD Online
USDA/NASA's Global Agricultural Monitoring (GLAM) project
Cropland Data Drilling with 250-meter MODIS-NDVI Time Series Data
Near-real Time Daily MODIS Images
Agroclimatic Map for Ethiopia
Ethiopia 2008 Crop Assessment Route
FAS/OGA/IPAD's Photo Gallery
Other Organizations Directly or Indirectly Involved
USAID's Famine Early Warning Systems Network (FEWS-NET)
United Nation's Word Food Program (WFP)
Monitoring of Agriculture with Remote Sensing (MARS) of the Joint Research Centre (JRC)
Geospatial Data Analysis Corporation or (GDA Corp)
GeoSpatial Experts. GPS-Photo Link Software
USGS-FEWS-NET. 2008. Africa Data Dissemination Service (ADDS)
Summary Photos
|