Iraq MY2013/14 Rice Area Assessment Using Landsat-8 Satellite Imagery
Rice has always been an important staple as part of the Iraqi diet. In the 1980s, Iraq imported large amounts of US rice to meet its growing demand. Rice is primarily grown in a concentrated area along the Euphrates River near the city of Najaf. The Euphrates River is the source of irrigation water for this area and having sufficient stream flow is crucial to Iraqi rice production. There have been years where Iraq rice production was significantly down because of low river levels necessitating a reduction in planted area either due to drought or to the construction of large reservoirs upstream.
Figure 1. Harvested rice area from 1970 to present (8).
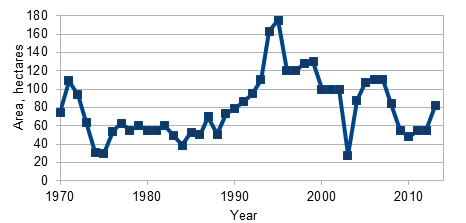
Harvested rice area has ranged from as high as 175,000 hectares to as low as 28,000 hectares since 1970 (Fig. 1). Only briefly in the early 1970’s was there sufficient rice production to meet the demand in consumption (Fig. 2). By the late 1990’s, domestic consumption greatly outpaced production even as area increased for a time accordingly.
Figure 2. Amount of rice produced and consumed from 1970 to present (8).

The distribution of rice grown in Iraq for market year (MY) 2007/08 is shown in Figure 3. By far the most significant rice growing region is the area along the Euphrates River just west of the city of
An Najaf with over 70 percent of the rice produced occurring in this stretch of the river – straddling the border between An Najaf and Al Qadisayah provinces. Other minor rice crops are grown in the state of Diyala (irrigated by water from the Tigris River), which produced 13 percent of the total production, followed by very minor percentages in the states of Wasit, Maysan, Dhi Qar, and Muthanna. Because sufficient river flow in both the Tigris and Euphrates Rivers is critical for a normal crop, year to year production percentages can fluctuate in the minor provinces.
The project was performed as a means to corroborate the rice area estimated by the COSIT (Central Organization for Statistics and Information Technology – Iraq Ministry of Agriculture) and the USDA for the 2013/14 Iraq crop. Regional rice area estimates using multi-temporal satellite imagery have been shown by others to produce reasonable results – but, each with their own set of objectives and varying methods (1, 2, 4, 5, 6).
Imagery from Landsat-8 was downloaded from the United States Geological Survey Earth Explorer website (9). Landsat-8 contains six multispectral bands at a pixel resolution of 30x30 meters with a repeat time of 16 days. Both the pixel size and the repeat time were more than sufficient for analysis with regard to the field size, crop growth rate and weather conditions of this region. The imagery was processed using Excelis ENVI 5.0 software. An initial early season set of imagery was acquired over the major rice areas when the fields would be predominately flooded, June and July.
Figure 3. Iraq rice production by province for the MY2007/08 (3).

The second set of Landsat-8 satellite imagery was obtained when the normalized difference vegetation index (NDVI) readings from the MODIS Aqua satellite for the Najaf rice fields were found to be near historical and current peak NDVI values (Fig. 4). These NDVI time series were obtained from the MODIS satellite based on an 8-day maximum value composite and were masked to confine pixels to the rice crop growing area. Bands 1 through 6 of the Landsat-8 imagery collected at peak NDVI were used to create a supervised classification of the rice fields using a maximum likelihood algorithm after the scenes were processed to atmospheric reflectance.
The rice field classification results were compared to the early flooded field imagery as means to evaluate the ability of this method to separate rice fields from other vegetation. Ground truth was not available and, therefore an accuracy assessment was not possible. Rice fields in the Najaf area were biased towards a slight over estimation, while rice fields in the minor provinces were hard to identify and most likely the rice classification underestimated the area.
Figure 4. Seasonal 8-day composite MODIS NDVI curves from 2013 to 2007 masked for the rice fields in the Najaf and Al Qadisiyah rice growing region (7).

The Landsat satellite scenes used to determine the rice area are shown in Figure 5. A rice area of 400 hectares was found in the minor producing provinces (Diyala, Wasit, Karbala, Al Muthanna, and Al Basrah) – which was much less than was reported by COSIT for 2007/08. More work will need to be done to determine where rice fields occur in the minor producing provinces. A better understanding for the crop calendar for those areas is also needed. By far the most
significant rice growing region is made up of the provinces of An Najaf and Al Qadisiyah that share a common border along the Euphrates River. A rice area of 76,600 hectares was found for these two provinces as a result of the classification (Fig. 5).
Together, the total for the rice area based on satellite imagery classification was estimated to be 77,000 hectares as compared to 80,000 hectares currently being reported by the USDA. This assessment only serves as a back stop toward support for the official rice area number reported by the COSIT and is not meant to serve as a definitive number given the errors that are inherent in satellite classification without adequate ground truth. It is encouraging that Landsat-8 imagery can be quickly used as an effective means towards an early warning should mid-season conditions not be favorable.
Figure 5. Iraq rice area classification based on Landsat-8 satellite imagery for MY2013/14.

References
1. Bailey, K.D., R.C. Frohn, R.A. Beck, and M.W. Price. 2001. Remote sensing analysis of wild rice production using Landsat 7 for the Leech lake band of Chippewa in Minnesota. Photogrammetric Engineering and Remote Sensing. 67:189-192.
2. Bridhikitti, A., and T.J. Overcamp. 2012. Estimation of Southeast Asian rice paddy areas with different ecosystems from moderate-resolution satellite imagery. Agriculture, Ecosystems & Environment. 146:113-120.
3. Central Office for Statistical and Information Technology. 2007. Iraq agricultural crop statistics. Iraqi Ministry of Agriculture. Baghdad, Iraq.
4. Hong, S. 1999. Estimation of rice field area using tow-date Landsat TM images in Korea. In IEEE 1999 Geoscience and Remote Sensing Symposium. IGARSS’99 Proceedings. 2:732-734.
5. Kuenzer, C., and K. Knauer. 2013. Remote sensing of rice crop areas. International Journal of Remote Sensing. 34:2101-2139.
6. Uchida, S. 2010. Monitoring of planting paddy rice with complex cropping pattern in the tropical humid climate region using Landsat and MODIS data – A case of West Java, Indonesia. International Archives of the Photogrammetry. 38:447-481.
7. United States Department of Agriculture. 2013. GLAM - Global agricultural monitoring program. http://www.pecad.fas.usda.gov/glam.htm (accessed 12 Dec 2013).
8. United States Department of Agriculture. 2013. Production, supply, and demand database online. http://www.fas.usda.gov/psdonline/psdquery.aspx (accessed 12 Dec 2013).
9. United States Geological Survey. 2013. Earth Explorer. USGS Earth Resources Observation and Science Center. http://earthexplorer.usgs.gov/ (accessed 12 Dec. 2013).
Article written by
William Baker, USDA FAS Office of Global Analysis; and, Christianna Townsend, Inutec LLC.
Visit Crop Explorer - http://www.pecad.fas.usda.gov/cropexplorer
Current USDA area and production estimates for grains and other agricultural commodities are available on IPAD's Agricultural Production page or at PSD Online.
|