Record Wheat Yields Expected for South Africa’s 2014/15 Wheat Crop
USDA’s September 11 forecast for 2014/15 South Africa wheat production is 1.8 million tons, which is nearly the same as last year’s output. Harvested area for 2014/15 is forecast at a record low 485,000 hectares or 20,000 hectares less than last year’s record low wheat area (Figure 1). Yield is forecast at a record 3.7 tons per hectare, or up 4 percent from last year. Yield increased due to excellent mid-season rainfall and crop conditions in the Western Cape where 90 percent of South Africa’s dryland wheat is produced.
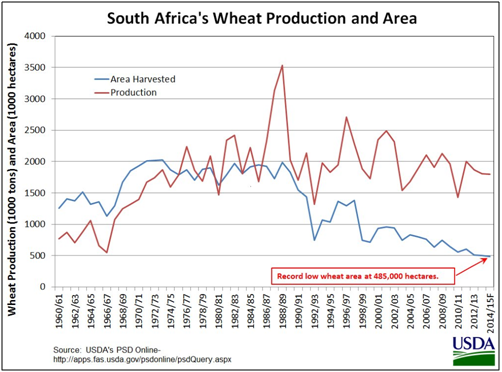
Figure 1. South Africa’s 2014/15 wheat production steady despite low area
As indicated in Figure 2, winter rainfall was above-average from April to July in the Western Cape and corresponding satellite-derived vegetation indices (Normalized Vegetation Index or NDVI) and time series profiles indicate above-average crop conditions for the entire growing season (Figures 3 and 4).
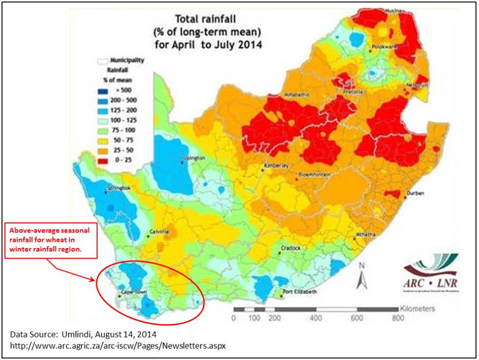
Figure 2. Percent of Mean Rainfall from April-July 2014
Historically, South Africa’s wheat yields and quality have varied widely due to unsteady and erratic seasonal rainfall in the southwestern part of the Western Cape where the winter rainfall season from April to October is highly variable. Figure 5 shows the correlation between national yields and yields in Western Cape, with the yield gap increasing as national wheat production relies more on irrigation. National wheat yields are greater than Western Cape because nearly 50 percent of South Africa’s wheat output is irrigated and only 10 percent of Western Cape’s output is irrigated. Other large wheat producing provinces include Northern Cape and Free State, where most of the wheat production is irrigated (refer to Figures 6 and 7).
In summary, the relatively strong correlation of Western Cape wheat yields to national yields indicates that monitoring Western Cape seasonal rainfall and NDVI may be useful in forecasting national wheat yields (Figures 4 and 5). In addition, the current mid-season NDVI time series analysis in Figure 4 indicates the cropland NDVI time series profile for Western Cape is analogous to 2012 when record wheat yields of 3.3 and 3.7 tons per hectare were achieved in Western Cape and South Africa, respectively (Figure 5).
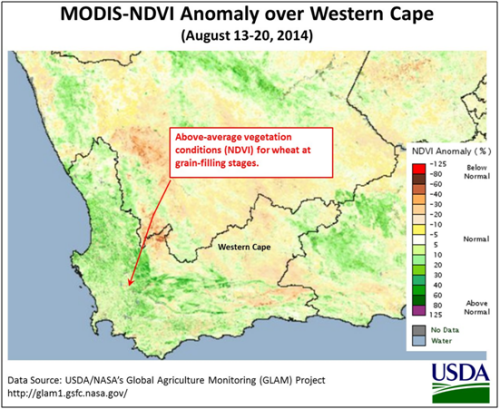
Figure 3. Above-Average MODIS-NDVI Anomaly for Western Cape
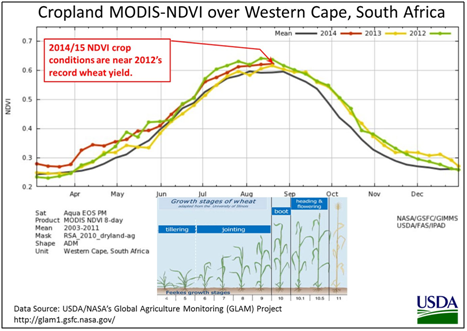
Figure 4. Above-Average 2014 Cropland NDVI Time Series Profile
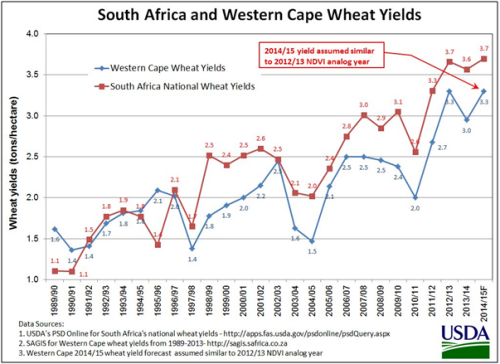
Figure 5. Historical Wheat Yields for Western Cape and South Africa
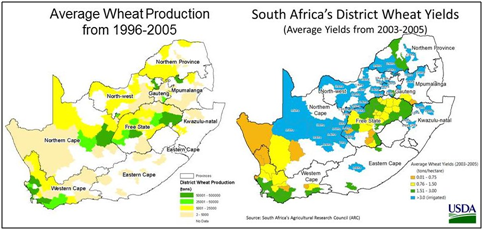
Figure 6. District-Level Wheat Production and Yields
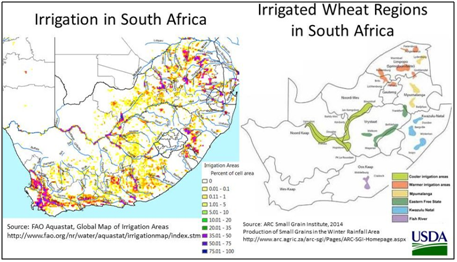
Figure 7. Irrigation Regions in South Africa
Related Links at FAS
PSD Online
http://apps.fas.usda.gov/psdonline
South Africa Grain and Feed Annual Report (March 14, 2014) from the USDA/FAS GAIN (Global Agricultural Information Network) reporting system
http://gain.fas.usda.gov/Recent%20GAIN%20Publications/Grain%20and%20Feed%20Annual_Pretoria_South%20Africa%20-%20Republic%20of_3-14-2014.pdf
Crop Explorer from USDA/FAS/OGA/IPAD
http://www.pecad.fas.usda.gov/cropexplorer/
MODIS-NDVI Time Series Data from USDA-FAS/NASA-GIMMS
http://glam1.gsfc.nasa.gov/
Current USDA area and production estimates for grains and other agricultural commodities are available on IPAD's Agricultural Production page or at PSD Online.
|