Record 2014/15 Wheat Harvest Expected for Ethiopia
Ethiopia wheat production for 2014/15 is estimated at a record 4.4 million tons, up 0.15 million tons from last year’s record crop. Harvested area is estimated at a record 1.8 million hectares, up 0.15 million from last year. Yield is estimated at a record 2.4 tons/hectare, due to favorable rainfall throughout the growing season in the wheat highland regions. Harvest of the 2014/15 crop has just finished. Wheat yield has been increasing since 2002 due to government initiatives that encouraged farmers to adopt improved seed varieties, increase fertilizer distribution, and expanded agriculture extension in rural areas (Please see Figure 1 for graph of wheat area, yield and production).
Ethiopia wheat is a cool-weather grain crop that is commonly grown at elevations ranging from 1,500 to 3,200 meters above sea level, with major wheat growing belts in the southern (i.e., Arsi and Bale) and central (i.e., Shewa and Gojam) highlands (Figure 2). The crop is grown mostly during the main (meher) rainy season from June to September and harvested from October through January.
Rainfall quantity and distribution during the 2014 meher season was favorable, as summarized by the cumulative Evapo-transpiration Anomaly (ETa) product (Figure 3). Relative crop conditions for Ethiopia’s 2014 meher growing season are shown in the satellite-derived vegetation indices for cropland Normalized Difference Vegetation Index (NDVI) time-series graphs for Oromia and Amhara regions (Figure 4). These two administrative regions account for approximately 60 and 30 percent of Ethiopia’s total wheat output, respectively. The NDVI time series graphs indicate that the 2014 meher growing season had a late start with delayed onset rains in June, and the meher season was extended beyond average into the month of October.
October 2014 Crop Assessment Travel to Southern Ethiopia
Personnel from USDA’s Foreign Agricultural Service (FAS) and USAID’s FEWSNET (Famine Early Warning Systems Network) traveled in southern Ethiopia from October 4-9, 2014 to assess 2014 crop conditions during the meher season and evaluate the performance of various spatial products during the 2014 belg season.
The crop assessment route taken by the team is shown in Figure 5 and was recorded by GPS track. The GPS elevation profile from the route is shown in Figure 6. The route was chosen, based on recent drought events in southern Ethiopia where spatial products indicated failed belg rains during April-June (Figure 7) and delayed onset of meher rains during June-July (Figure 8).
Ethiopia’s diverse agro-ecology and high elevations make it ideal for evaluating the performance of satellite-derived spatial products, such as the new cumulative ETa Anomaly images produced by USGS/FEWSNET (Figures 3 and 8). In addition, Ethiopia grows a wide variety of crops with major agro-ecology zones (AEZ) shown in Figure 9 and the AEZ’s derived from elevation, annual rainfall and dominant cereal crop grown throughout the country (Figures 10-12).
The highest elevation reached by the crop assessment team was within Arsi administrative zone, and Bekoje district, where wheat, barley and teff are predominately grown. The lowest elevation was within Konso district, where sorghum is grown (Figure 6). Photos showing the contrast in crops grown in highland Bekoje and lowland Konso administrative districts are shown in Figures 13 and 14. In addition, Bekoje’s high elevation and high annual rainfall typically prevents it from requiring food assistance for most years, while Konso’s low elevation and low annual rainfall typically results in a requirement for food assistance during most years (Figure 15).
Lower 2014/15 Corn Harvest Expected Due to Failed 2014 Belg Rains
The two main crop seasons in Ethiopia are the belg and meher seasons which receive rainfall from February to June and from June to October, respectively. The meher crop season is the main season and produces 90-95 percent of the nation’s total cereals output, and the belg harvest provides the remaining 5-10 percent of cereal output. For the belg harvest, corn accounts for approximately one-half of the belg’s cereal production, with last year’s belg crop producing slightly over 0.6 million tons of corn (CSA report, Oct 2014, see link). The remaining belg output is comprised of mostly short-cycle wheat, barley, and teff.
In some highland regions, the belg and meher seasons merge into one extended growing period whereby both long-cycle grains (such as sorghum and corn) and short-cycle small grains (such as wheat, barley, and teff) can be grown. To avoid confusion between these two growing seasons, the Ethiopian belg crop season is officially defined as any crop harvested between March and August, while the meher crop season is defined as any crop harvested between September and February. For the meher harvest, over three-fourths of Ethiopia’s corn output is produced in Oromia and Amhara regions.
During the 2014 crop assessment, various farmers and government officials were interviewed along the crop assessment route. In the Arsi zone, government officials and farmers reported that little to no belg crops were harvested due to the failure of the 2014 belg rains. The Arsi farmers also planted short-cycle wheat, barley and teff meher crops directly behind the failed belg corn crop. Corn farmers along the Rift Valley and surrounding highland areas also reported that meher corn harvest prospects are expected to be lower than last year due to the failed 2014 belg rains and a late onset of 2014 meher rains.
Crop conditions for Ethiopia’s 2014 belg season are summarized by the cumulative ETa product shown in Figure 8. It illustrates poor crop conditions from the failed 2014 belg season in Arsi administrative zone, as well as poor crop conditions along the Rift Valley from delayed onset of June-July rains for the start of the meher season.
In summary, the 2014/15 corn harvest should be below last year’s record crop of 7.4 million tons, due to failed belg rains and the late onset of meher rains in June-July. USDA estimates 2014/15 corn production at 6.5 million tons, and down 0.95 million from last year.
Performance Evaluation for ETa Anomaly and MODIS-NDVI Time Series Products
The two main spatial products evaluated for performance during the belg and meher growing seasons were the ETa Anomaly and NDVI time-series products derived from the MODIS (Moderate Resolution Imaging Spectro-radiometer) satellite sensor onboard NASA’s Aqua satellite. These spatial products are produced every eight days and droughts are quickly detected within Ethiopia by comparing current vegetation conditions to average conditions from 2003-2013.
Seasonal ETa Anomaly products are now produced for both belg and meher seasons and distributed by the FEWSNET data portal. Other spatial products are available from the FEWSNET data portal and these spatial products assist in detecting droughts or below-average rainfall regions during the belg and meher seasons. For example, the Start of Season (SOS) Anomaly product derived from NOAA’s rainfall estimated (RFE) product was useful for detecting early failure of the 2014 belg rains (Figure 12). In addition, USDA/NASA’s GLAM (Global Agriculture Monitoring) web site provides MODIS-NDVI images and time-series graphs that detect droughts worldwide and indicated failed 2014 belg rains in Ethiopia, with late onset of 2014 meher rains in June-July (Figure 4).
The spatial resolution for MODIS derived products such as ETa Anomaly products and MODIS-NDVI images is 1-kilometer and 250-meters resolution, respectively. The new 1-kilometer ETa Anomaly product has many advantages over traditional rainfall products that have coarser resolution (i.e., 10-kilometer or more) and have many known errors and biases over Ethiopia’s highland and lowland regions. The MODIS-NDVI Anomaly products are free, easily available, and have global coverage with 250-meter spatial resolution. The MODIS-NDVI archive extends over 10 years and allows current crop conditions to be compared to 10-year average conditions (refer to USDA/NASA GLAM web site below).
The ETa Anomaly products have another advantage in that they can monitor irrigated agriculture in large irrigation schemes by downscaling 100-meter resolution Landsat-8 thermal band imagery with MODIS 1-kilometer ETa Anomaly products. These 100-meter Landsat-8 ETa Anomaly images are therefore very useful for crop monitoring irrigated agriculture, while the 1-kilometer MODIS ETa Anomaly products are useful for crop monitoring dryland or rain- fed agriculture.
After the 2014 crop assessment was conducted, USDA/FAS team members observed that the new ETa Anomaly products closely corresponded with MODIS-NDVI products in both highland and lowland agro-climates. In addition, the new MODIS-derived 1-kilometer ETa Anomaly products provide the following advantages:
1. Early drought detection for both belg and meher growing seasons.
2. Summary seasonal products for both belg and meher growing seasons.
3. Better 1-kilometer spatial resolution than traditional 10-kilometer rainfall products which allow ETa Anomaly products to be very useful for drought monitoring numerous micro-climates within Ethiopia.
4. Useful for monitoring irrigated agriculture within large irrigation schemes because the MODIS 1-kilometer ETa Anomaly products can be downscaled to 100-meter resolution by utilizing Landsat-8 (100-meter) thermal band imagery.
In summary, cumulative ETa Anomaly and MODIS-NDVI time-series products are two reliable tools for crop monitoring Ethiopia’s highland and lowland regions. Both of these spatial products indicate that Ethiopia should have a bumper 2014/15 wheat harvest from the meher growing season, while the 2014/15 corn harvest should be below last year’s record crop due to failed 2014 belg rains and late onset of June-July rains during the meher season.
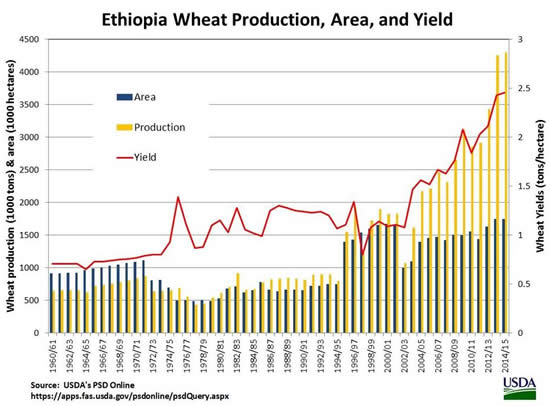
Figure 1. Ethiopia Wheat Production, Area and Yield
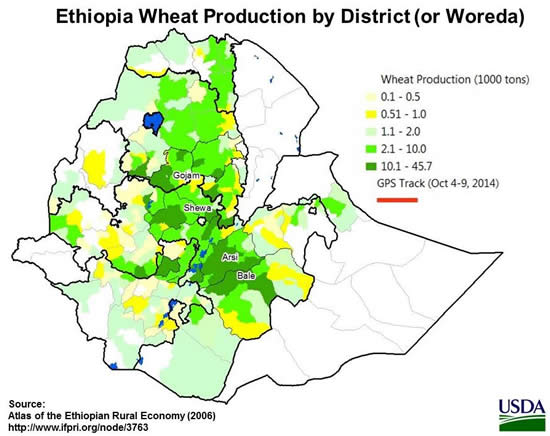
Figure 2. Ethiopia Wheat Production by District

Figure 3. 2014 Meher Season (Cumulative ETa Anomaly)
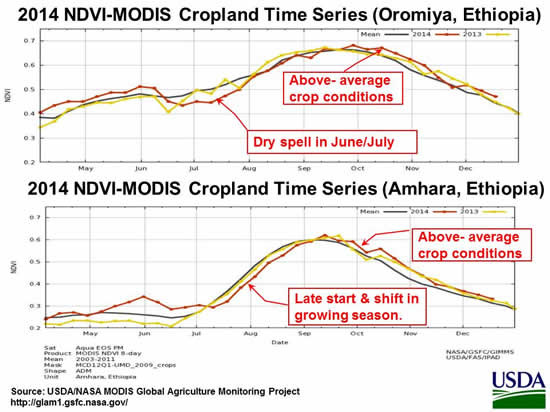
Figure 4. 2014 MODIS-NDVI Time Series (Oromia and Amhara, Ethiopia)
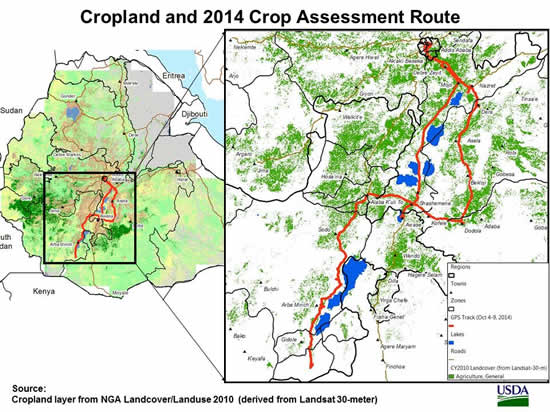
Figure 5. Cropland and 2014 Crop Assessment Route
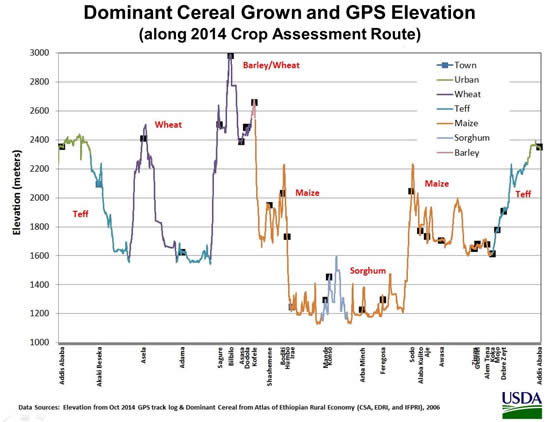
Figure 6. Dominant Cereal Grown and GPS Elevation Profile

Figure 7. Start of Season (SOS) Anomaly (2014 Belg rains)
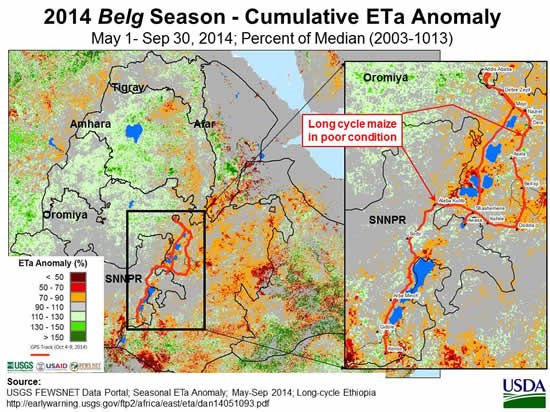
Figure 8. 2014 Belg Season (Cumulative ETa Anomaly)
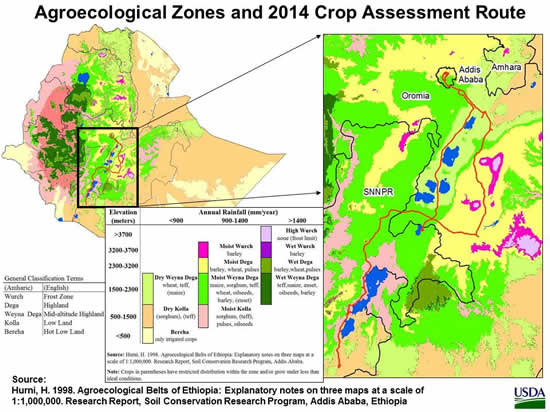
Figure 9. Agroecological Zones and 2014 Crop Assessment Route
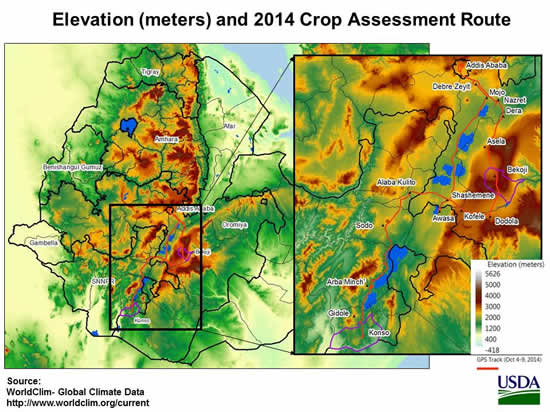
Figure 10. Elevation (meters) and 2014 Crop Assessment Route
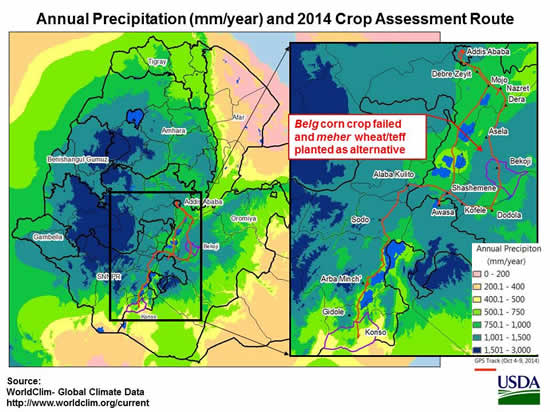
Figure 11. Annual Precipitation and 2014 Crop Assessment Route
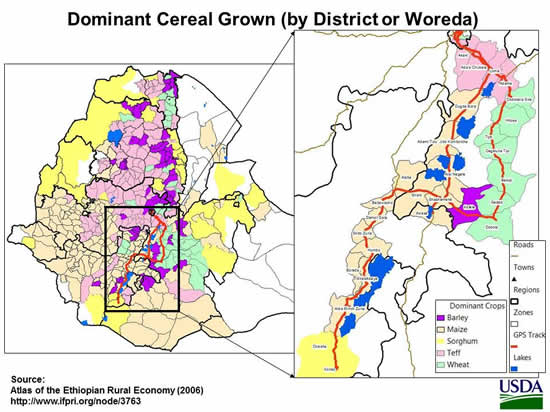
Figure 12. Dominant Cereal Grown (by District or Woreda)

Figure 13. Teff, Wheat and Barley along 2014 Crop Assessment Route
(approximate highest elevation photo at 2980 meters)
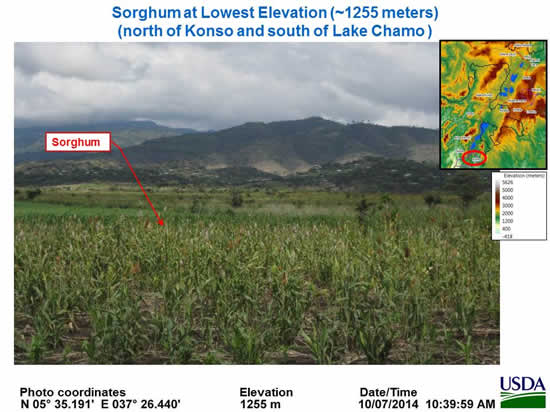
Figure 14. Sorghum along 2014 Crop Assessment Route
(approximate lowest elevation photo at 1255 meters)
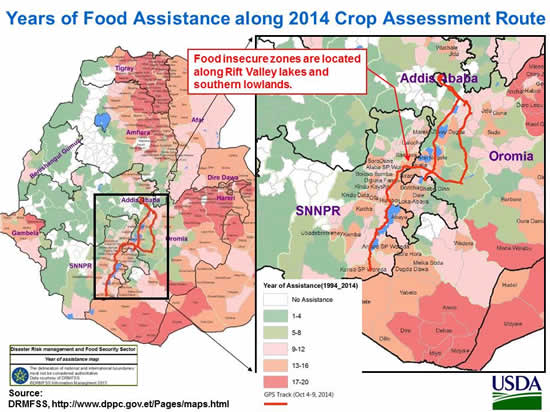
Figure 15. Years of Food Assistance along 2014 Crop Assessment Route
Related Links at FAS
FAS Grain and Feed Annual Report for Ethiopia (March 14, 2014) from the USDA/FAS GAIN (Global Agricultural Information Network) reporting system
MODIS-NDVI Images and Time-Series Data from USDA/NASA’s GLAM (Global Agriculture Monitoring) web site
Crop Explorer from USDA/FAS
PSD Online from USDA/FAS
Other Related Links
ETa Anomaly and Rainfall Estimate (RFE) products from USAID’s FEWSNET project
October 2014, Central Statistics Agency (CSA), 2013/14 Report on Area, Production and Farm Management, Statistical Bulletin 532, Addis Ababa, Ethiopia
Current USDA area and production estimates for grains and other agricultural commodities are available at PSD Online.
|