Delayed Winter Rains Reduce South Africa’s 2015/16 Wheat Prospects
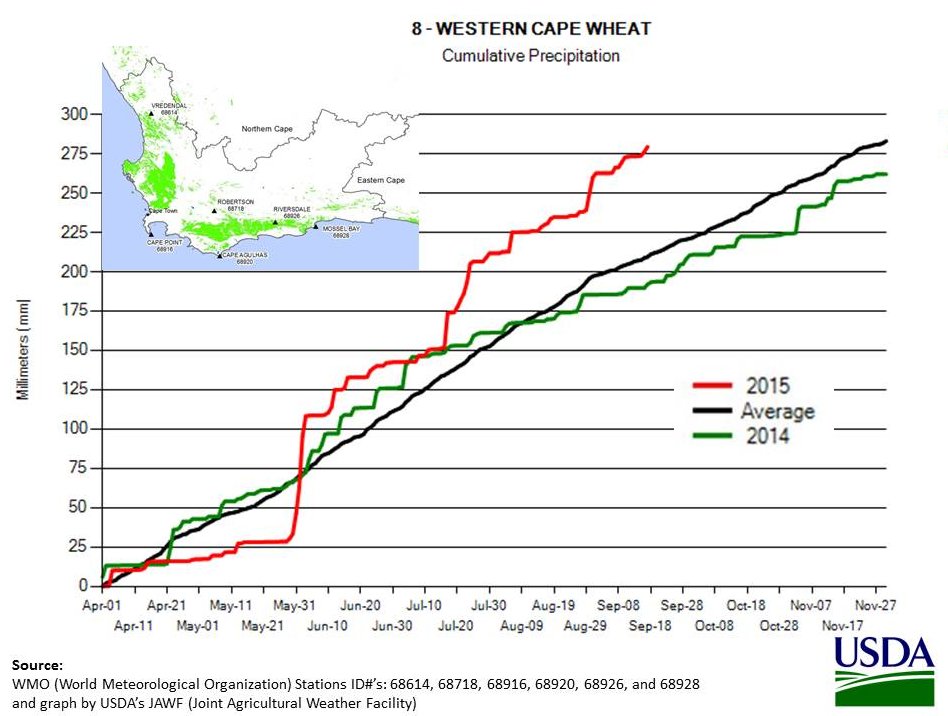
Seasonal winter rains for planting wheat were delayed in South Africa’s Western Cape Province during May 2015. Winter wheat in the Western Cape accounts for over 50 percent of South Africa’s total wheat production where wheat is planted in May and harvested in November. Vegetation conditions in the Western Cape were dry in early June but recovered in late August (Figure 1). Seasonal rainfall was average to above-average during the second half of the growing season (Figure 2), but wheat yields are not expected to reach full potential due to delayed planting and dry crop establishment from May through mid-July.
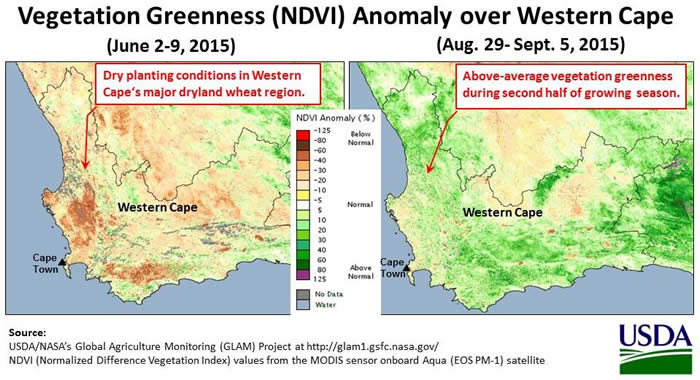
Figure 1. Vegetation Greenness (NDVI) Anomaly for Western Cape Province.
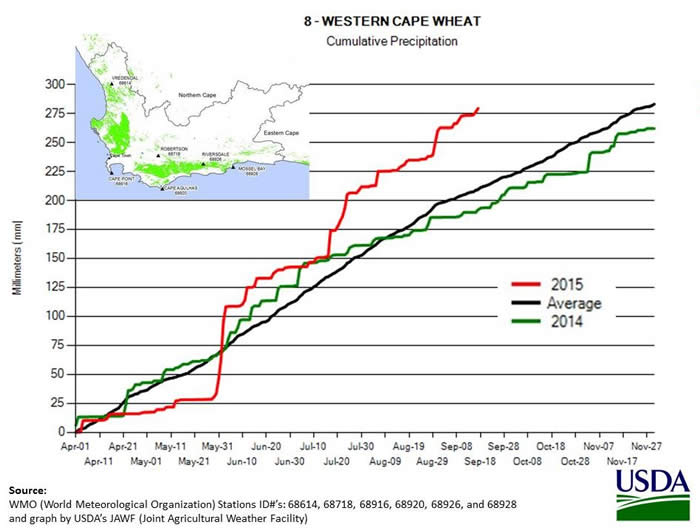
Figure 2. Seasonal Winter Rainfall in Western Cape from April 1–September, 17, 2015
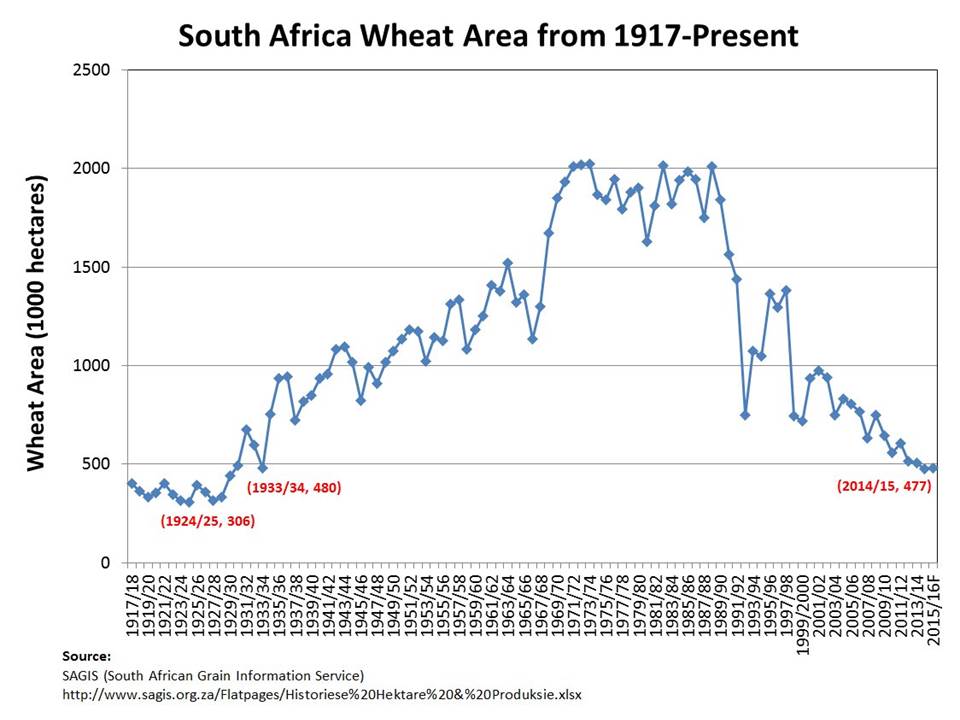
USDA’s current forecast for South Africa’s wheat yield is 3.52 tons/hectare, down from last year’s record wheat yield of 3.67 tons/hectare. Harvested 2015/16 area is forecast at 480,000 hectares, up 3,000 hectares from last year’s smallest wheat area harvested since 1933 (Figure 3). Total wheat production is forecast at 1.69 million metric tons (MMT), down 60,000 tons from last year’s output of 1.75 MMT.

Figure 3. Historical Wheat Area
The Western Cape and Free State provinces typically produce two-thirds of the crop, with the Western Cape producing nearly 50 percent of South Africa’s total wheat output and over 90 percent of South Africa’s total dryland wheat production (Table 1). Most wheat produced in the Western Cape is under dryland conditions, with the southwestern part of the Western Cape being one of the most important wheat producing regions in South Africa. Other large wheat producing provinces include Northern Cape and Free State, but most wheat production is by irrigation for all provinces other than Western Cape. In summary, approximately 25 percent of SOuth Africa's wheat area is irrigated and approximately 75 percent of total wheat planted area is cultivated under dryland conditions, with the Western Cape producing nearly 50 percent of total output.
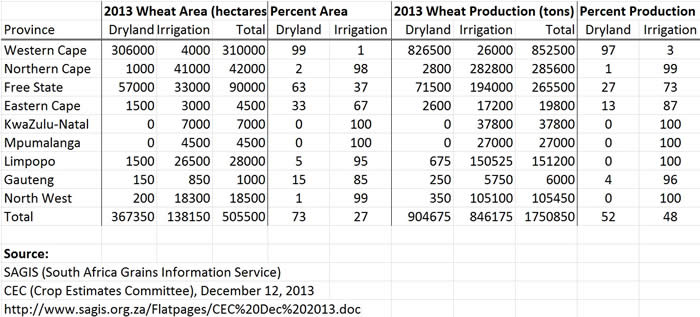
Table 1. Estimated 2013 Dryland and Irrigated Wheat Production by Province.
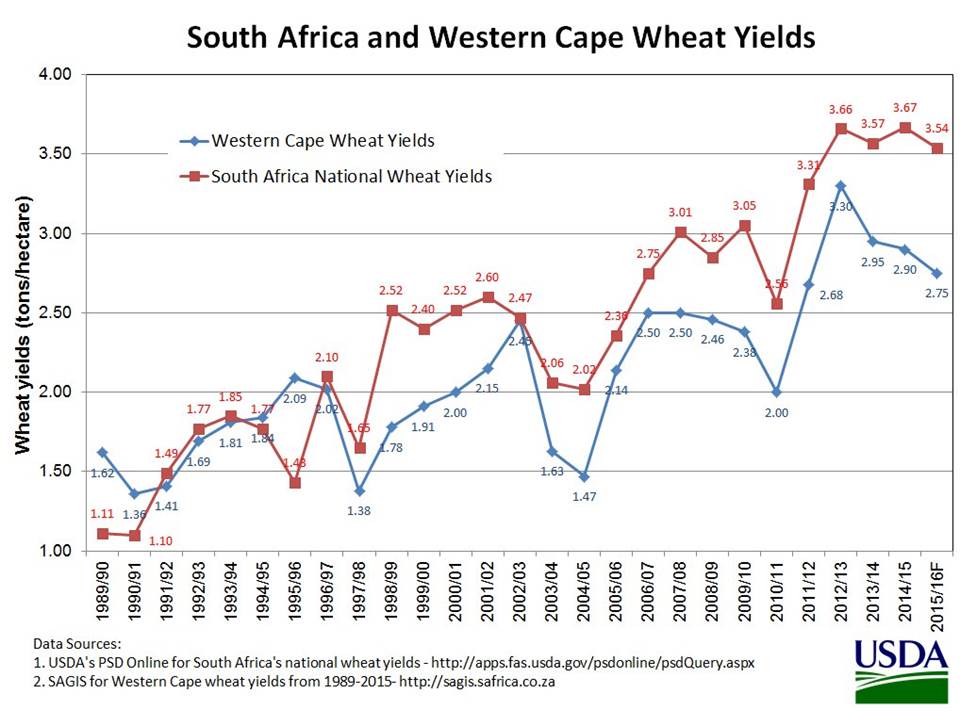
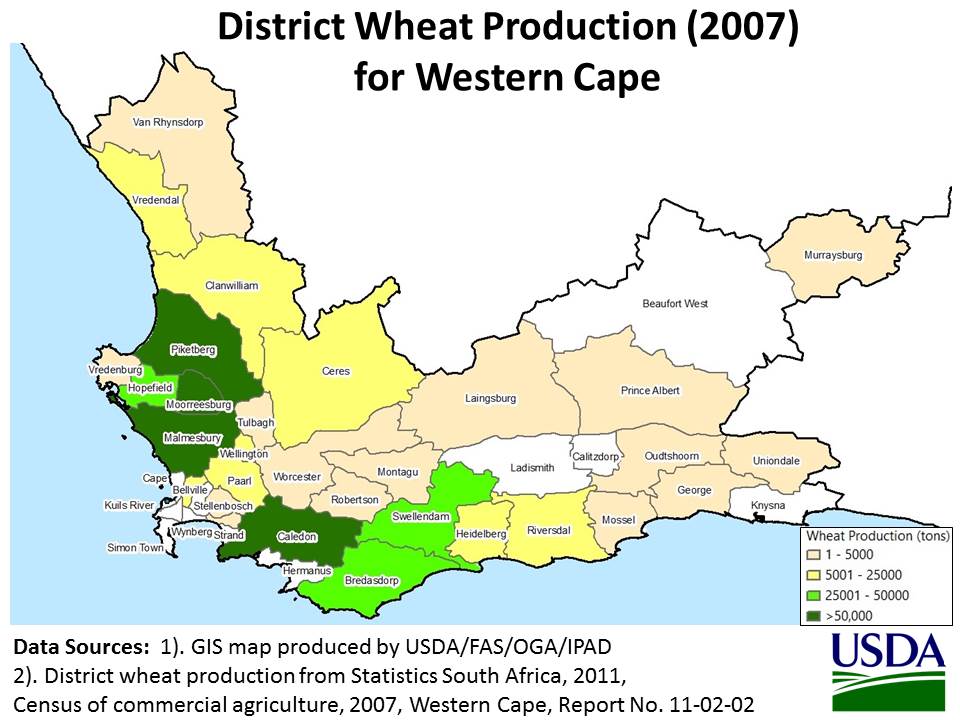
Historically, South Africa’s wheat yields and quality have varied widely due to unsteady, highly variable and erratic seasonal rainfall in the southwestern part of the Western Cape (Figure 4). Western Cape's major dryland wheat production is located in two regions (Figure 5); one region located northeast of Cape Town (Malmesbury and Piketberg districts) and the other region located southeast from Cape Town (Caledon and Swellendam districts).
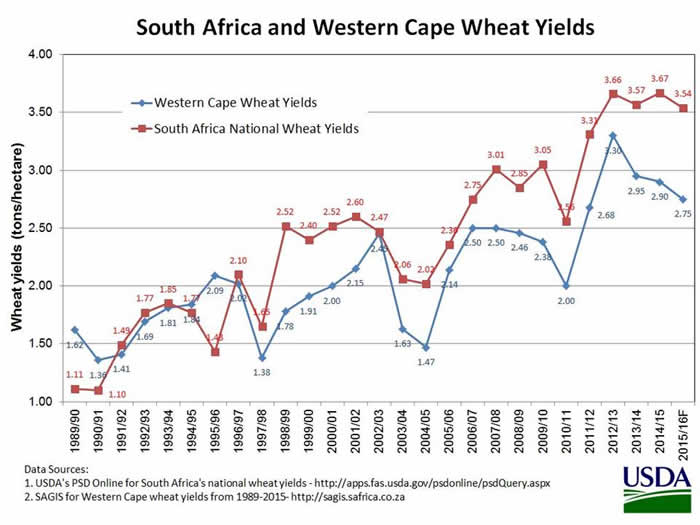
Figure 4. Historical Wheat Yields for South Africa and Western Cape province

Figure 5. District Wheat Production (2007) for Western Cape Province
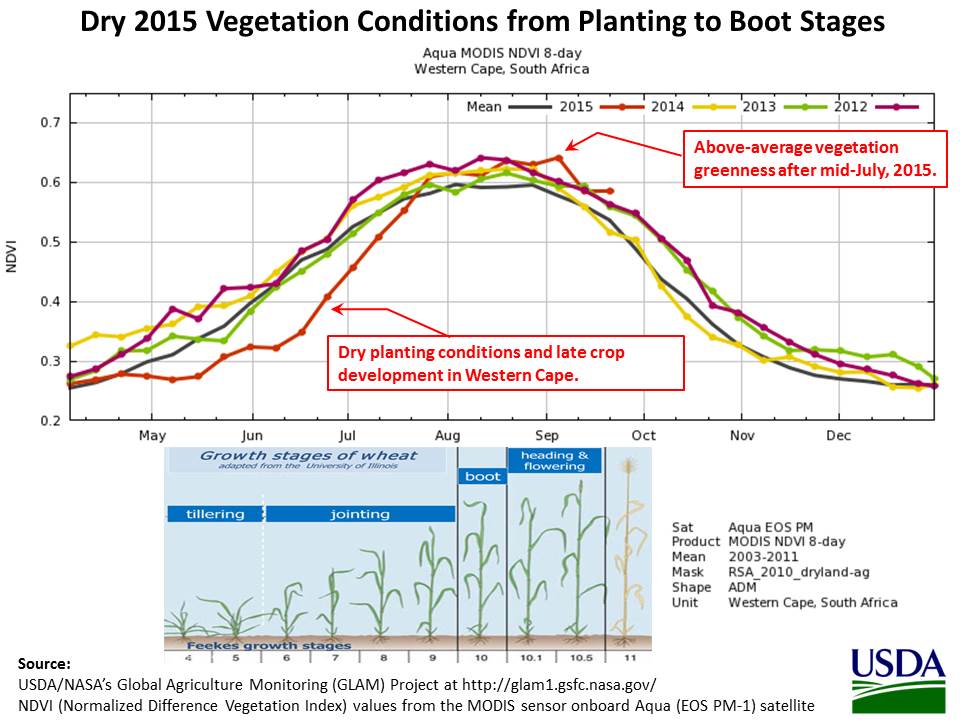
USDA’s wheat yield forecast for South Africa is largely based on cumulative rainfall and NDVI analysis in the Western Cape for the two major dryland wheat production regions located northeast and southeast from Cape Town (Figures 2 and 6). Seasonal vegetation greenness values (or NDVI) in Western Cape is shown in Figure 6 and indicates dry crop conditions from May through July, 2015 and wet conditions during the second half of the growing season. These early dry conditions are expected to reduce 2015 wheat yields in the Western Cape, as well as reduce total 2015/16 national yields to 3.52 tons/hectare, or below last year’s record wheat yield of 3.67. Record to near-record wheat yields was achieved by South Africa during the past three years (Figure 4), but record wheat yields are not expected in 2015 due to dry planting and vegetation conditions in Western Cape from May through July, 2015.

Figure 6. Dry Vegetation Conditions (or low NDVI values) from planting to boot stages.
This report on South Africa’s 2015/16 wheat crop was provided by the Office of Global Analysis (OGA), International Production Assessment Division (IPAD). Current USDA area and production estimates for grains and other agricultural commodities are available at PSD Online.
Related Links at FAS
PSD Online
http://apps.fas.usda.gov/psdonline/psdQuery.aspx
Crop Explorer
http://www.pecad.fas.usda.gov/cropexplorer/Default.aspx
USDA/NASA GLAM (Global Agriculture Monitoring) System for MODIS-NDVI Time Series Graphs
http://glam1.gsfc.nasa.gov/
WMO Station Explorer
http://gis.pecad.fas.usda.gov/WmoStationExplorer/
South Africa Grain and Feed Annual Report (March 17, 2015) from the USDA/FAS GAIN (Global Agricultural Information Network) reporting system
http://gain.fas.usda.gov/Recent%20GAIN%20Publications/Grain%20and%20Feed%20Annual_Pretoria_South%20Africa%20-%20Republic%20of_3-17-2015.pdf
Commodity Intelligence Report from USDA/FAS/OGA/IPAD (September 22, 2014)
"Record Wheat Yields Expected for South Africa’s 2014/15 Wheat Crop"
http://pecad.fas.usda.gov/highlights/2014/09/SAfrica/index.htm
Commodity Intelligence Report from USDA/FAS/OGA/IPAD (August 12, 2013)
"South Africa’s 2013/14 Wheat Area Remains Low, While Wheat Imports Continue to Rise"
http://www.pecad.fas.usda.gov/highlights/2013/08/SouthAfricaWheat/
|