El Niño Drought Reduces 2015/16 Corn Prospects in South Africa
A severe drought induced by one of the strongest El Niño’s on record reduced the 2015/16 forecast for corn production in South Africa by nearly 50 percent from the 5-year average. The center of the drought occurred in western Free State and North West provinces, where 60 percent of South Africa’s corn is typically grown (Figures 1-2). The drought was most intense during the planting season (October through December) which hampered planting and significantly reduced planted area. Many parched fields with no crop or vegetation cover were then prone to dust storms and wind erosion by early February, reminiscent of the dust storms in the US prairie states during the 1930’s Dust Bowl (Figure 3).
Satellite imagery from Landsat and MODIS (Moderate Resolution Imaging Spectroradiometer) revealed large swaths of land with bare soils during the planting season and some regions with no plant emergence during the entire growing season from October through April 2016 (Figures 4-6). Landsat imagery analysis for March 2015 and March 2016 also indicate that corn area was reduced by nearly 1 million hectares.
Total 2015/16 South Arica corn area is estimated by USDA at 1.9 million hectares, down 1.1 million hectares or 33 percent from the previous year. Output is forecast at 6.5 million metric tons, down 5.9 million or 47 percent from the 5-year average. The forecast yield is 3.42 tons per hectare, down 15 percent from the 5-year average.
NOAA’s Oceanic Niño Index (ONI) compares El Niño and La Niña strengths from 1950 to present (Figure 8). This index is defined by NOAA as the running 3-month mean Sea Surface Temperature (SST) anomaly for the Niño 3.4 region, a region in the Pacific Ocean where water temperatures have been measured since 1950. “Strong” and “very strong” El Niño events (or warm waters in the Pacific’s Niño 3.4 region) tend to peak in December or January, with December corresponding to the end of South Africa’s planting season and January marking the beginning of South Africa’s corn growing season (Figure 9). El Niño strength classifications (as measured by ONI) are color coded according to the strength of El Niño events (i.e., “strong/very strong” or “weak/moderate”) and plotted with South Africa corn yield statistics from 1983-2016 (Figure 10).
In 1991/92 South Africa’s corn crop also suffered from a devastating El Niño-induced drought and corn output for 1991/92 was only 3.3 million tons (Figure 11). The 1991/92 El Niño had little drought impact during the 1991 planting season and planted area was not affected, but yield was drastically reduced in both eastern and western corn production regions of South Africa. In contrast, the 2015/16 El Niño drastically reduced area but yields were not reduced nearly as much as yields during the 1991/92 El Niño. (Figure 12)
In summary, “strong” to “very strong” El Niño events, as measured by ONI, can be used as a guide by farmers in making planting decisions in South Africa. When ONI forecasts indicate extreme El Niño events (or “strong” and “very strong” ONI classifications) in October, the farmer should realize that corn yields have a strong probability to be 40 percent below the 5-year average or seasonal rains will not be enough to plant, as happened during the 2015/16 El Niño. However, if the ONI forecast in October does not indicate a strong El Niño event, then significant impacts on crop yields and production cannot be reliably determined and the farmer may assume average rainfall and planting conditions for the upcoming season.
Current USDA area and production estimates for grains and other agricultural commodities are available at PSD Online.
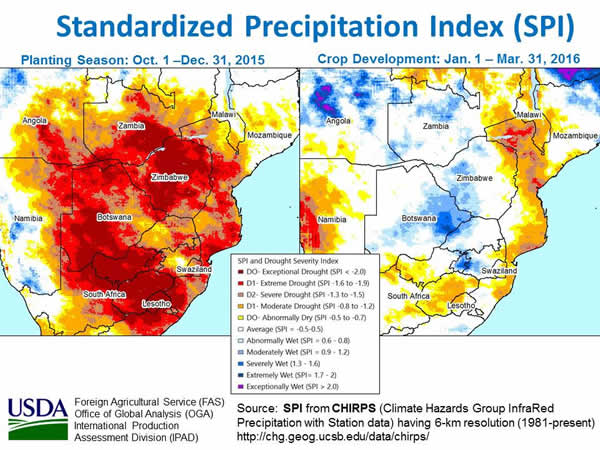
Figure 1. Standardized Precipitation Index (SPI) for Southern Africa
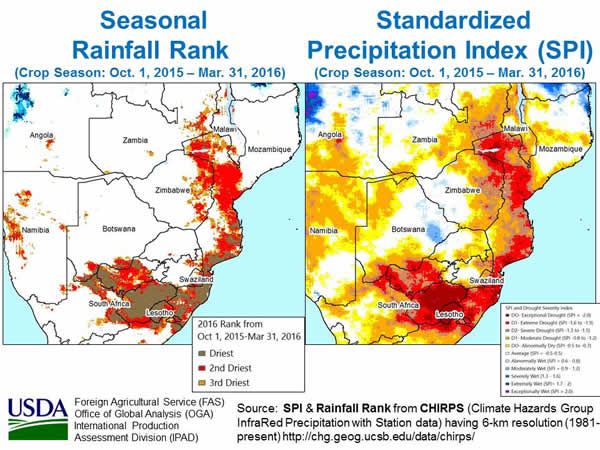
Figure 2. Seasonal Rainfall Rank and SPI from October 2015 through March 2016.
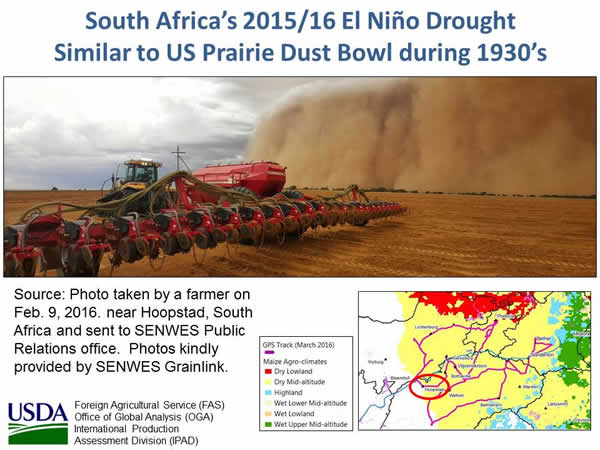
Figure 3. 2015/16 El Niño peaked in January 2016, after South Africa’s planting season.
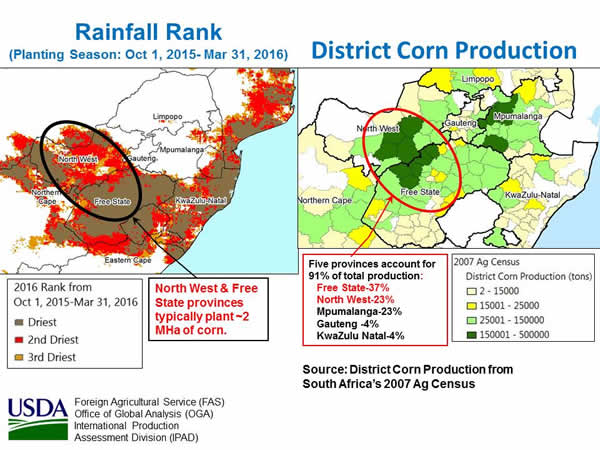
Figure 4. NDVI satellite imagery indicates bare soil in mid-January, 2016
for the North West and Free State provinces.
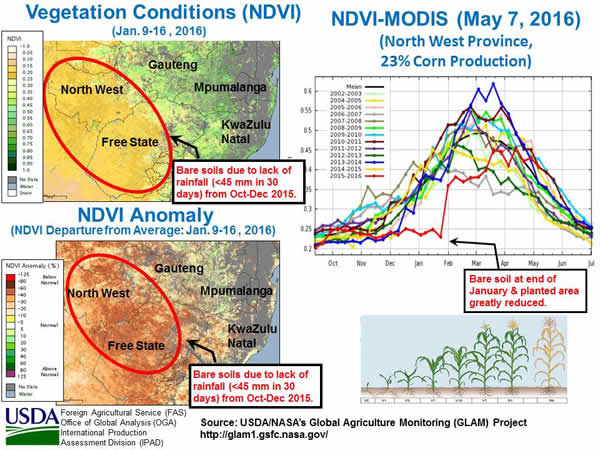
Figure 5. Landsat satellite imagery shows bare soil in mid-February, 2016.
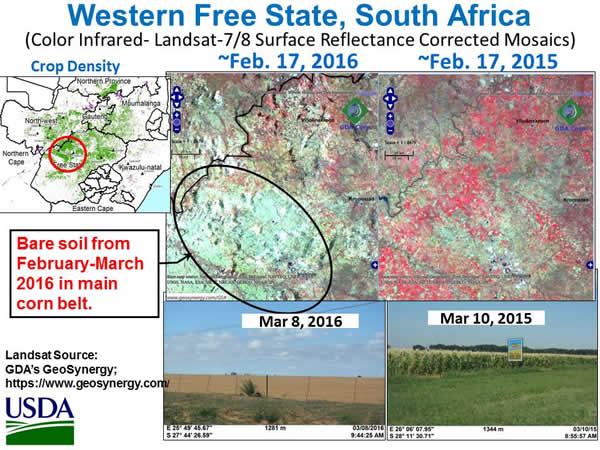
Figure 6. Landsat satellite imagery shows bare soils in early March and early April, 2016.
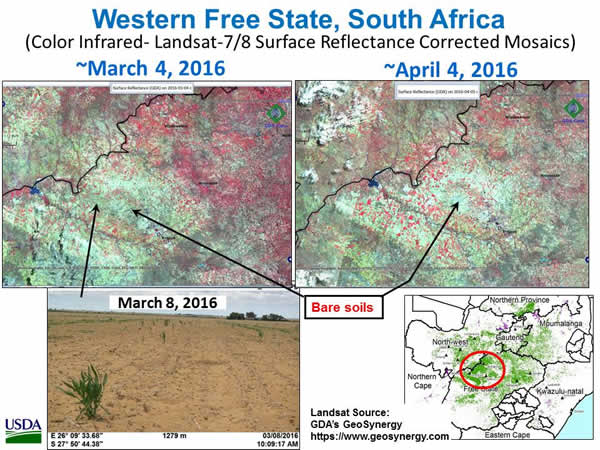
Figure 7. El Niño Induced Dust storms in South Africa (February 9, 2016).
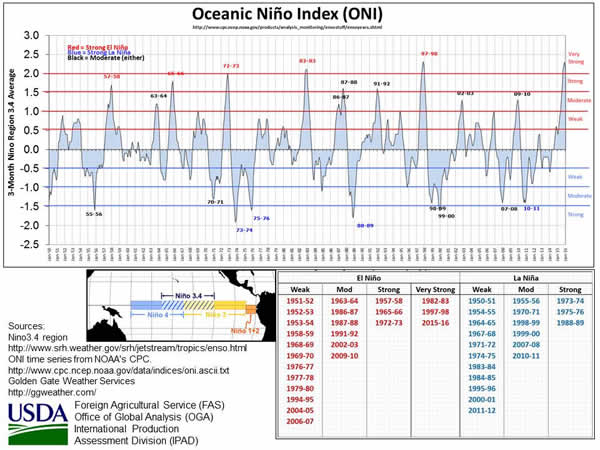
Figure 8. El Niño’s intensity is measured by NOAA’s Oceanic Niño Index (ONI).
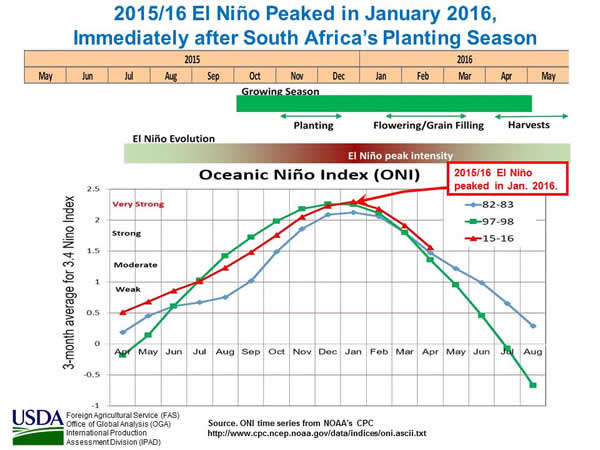
Figure 9. 2015/16 El Niño peaked in January 2016 which is immediately after South Africa’s planting season.
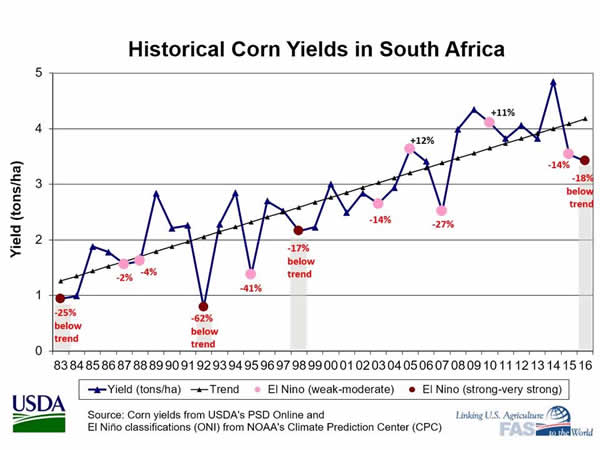
Figure 10. Historical Corn Yields in South Africa
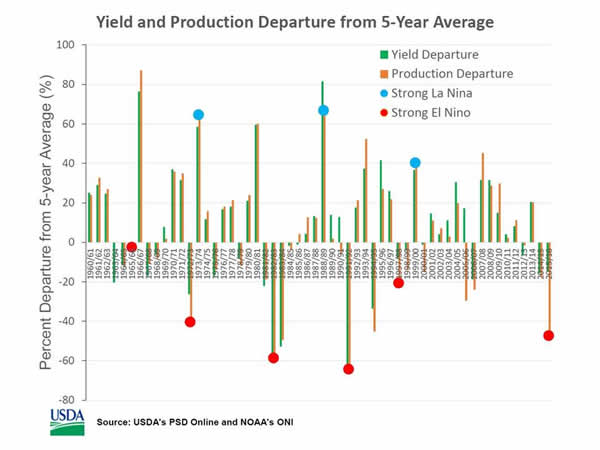
Figure 11. Strong El Niño and La Niña Events Compared to Corn Yields and Production in South Africa
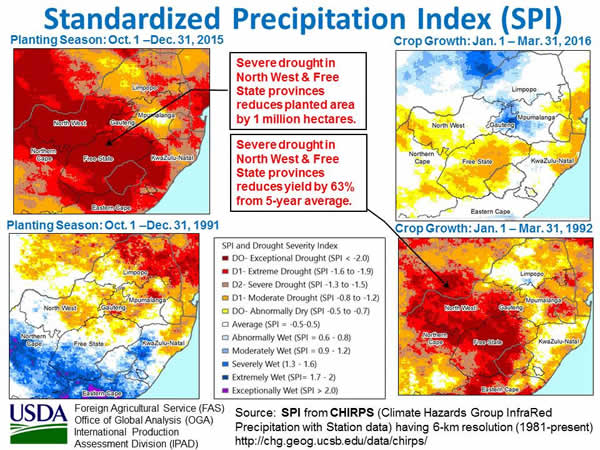
Figure 12. Drought Severity Comparison between 1991/92 and 2015/16 El Niño
Other FAS Related Links
Commodity Intelligence Reports (CIR) for South Africa with El Niño or La Niña Impacts
Drought Delays 2015/16 Corn Planting in South Africa- November 19, 2015
http://pecad.fas.usda.gov/highlights/2015/11/RSA/index.htm
South Africa faces low corn supply after disappointing seasonal rains-May 2, 2012
http://www.pecad.fas.usda.gov/highlights/2012/05/south_africa/
Severe El Niño Drought Wilts Summer Grain Crops in Southern Africa- May 2, 2007
http://www.pecad.fas.usda.gov/highlights/2007/05/southern_africa_corn_may07/
FAS Annual GAIN report for South Africa’s Grain and Feed (March 24, 2016)
http://gain.fas.usda.gov/Recent%20GAIN%20Publications/Grain%20and%20Feed%20Annual_Pretoria_South%20Africa%20-%20Republic%20of_3-24-2016.pdf
Crop Explorer
http://www.pecad.fas.usda.gov/cropexplorer/
USDA/NASA GLAM (Global Agriculture Monitoring) Project with global MODIS and NDVI Imagery
http://glam1.gsfc.nasa.gov/
G-REALM (Global Reservoirs and Lakes Monitor)
http://www.pecad.fas.usda.gov/cropexplorer/global_reservoir/
PSD Online
http://apps.fas.usda.gov/psdonline/psdquery.aspx
|