South Africa: Trip Report on Crop Assessment Travel and Drought Monitoring Tools
Personnel from USDA’s Foreign Agricultural Service (FAS) and USAID’s FEWSNET (Famine Early Warning Systems Network) project traveled within South Africa’s corn-belt from March 7-11, 2016 to validate satellite imagery products used to monitor regional droughts, assess crop conditions and estimate crop area. One of the most striking features observed while traveling in early March was the large spatial extent of parched fields with bare soils in the western corn belt where crops should have been fully grown, tasseled and in various grain-filling stages. Fields with bare soils and failed crops in early March provided a unique opportunity to validate the effectiveness of spatial products for drought monitoring and crop condition assessments. Brief performance summaries for key drought monitoring tools are presented below, especially those spatial products that specialize in measuring drought severity, duration and spatial extent, as well as products that measure relative crop conditions and crop yield potentials.
The 2015/16 drought in South Africa was also the first growing season for the crop assessment team to utilize CHIRPS (Climate Hazards Group InfraRed Precipitation with Station data) rainfall products produced by the University of California-Santa Barbara (UCSB). Timely Standardized Precipitation Index (SPI) images are generated from CHIRPS data with 10-day, monthly, 2-monthly and 3-monthly time steps, and these operational products were very useful in targeting drought intensity, duration and spatial extent (Figure 1). Seasonal Rainfall Ranking images were also used determine the driest regions in the past 35 years. The region with the most severe and most extensive dryness was located in western Free State and North West provinces, South Africa’s most important crop production region (Figures 1-3).
A large “no start of season” region in South Africa’s western corn belt was also detected from Onset-of-Rains or Start of Season (SOS) image, as shown in Figure 4. The Onset-of-Rains and SOS Anomaly images are produced by a Start of Season (SOS) algorithm where 25 millimeters of rainfall during 10 days initializes a Start of Season (SOS) and 20 millimeters of rainfall during the next 20 days assumes that crop emergence was successful. The current SOS is then compared to historical average SOS and a SOS Anomaly image indicates if seasonal rains arrived early or late. Because the 2015/16 drought did not provide 45 millimeters of rainfall within 30 days, a large “no start of season” region was apparent in early January and most planting was delayed by 40 days or more in South Africa’s western corn belt (Figures 4 and 5). Abundant rains finally arrived in mid-January and some farmers took advantage of the late January rains to plant crops beyond the typical deadline (Figure 5). Many of these late-planted fields, however, had little chance of survival and by early March were abandoned or used for grazing.
As a method to measure the relative impact of dry spells on potential crop yields, percent median WRSI (Water Requirement Satisfaction Index) images are produced every 10 days by USAID’s FEWSNET project. Rainfall Estimate (RFE) images from FEWSNET are used to produce the WRSI and SOS images every 10 days. WRSI is a water-balance model originally developed by the Food and Agricultural Organization (FAO) and it monitors crop performance based on the availability of rainfall during the growing season. The WRSI accounts for water gained by precipitation and lost by evapotranspiration in daily time increments, with the plant’s total seasonal water consumption estimated and accounted during the entire growing season. The final WRSI model output is a crop "water satisfaction index" where an index of 100 indicates an excellent crop due to adequate rainfall and an index of 50 indicates crop failure from lack of rainfall or water for the crop.
The final percent median WRSI image for South Africa’s growing season is shown in Figure 6, along with the GPS crop assessment route overlaid the WRSI image . The yellow “no start of season” region in Figure 6 corresponds to the dry and bare soil region observed by the crop assessment team in early March. Other WRSI related products produced by FEWSNET were evaluated by the crop assessment team by draping the GPS route over other geospatial products such as crop progress, SOS, and SOS Anomaly images. In addition, WRSI- and SOS-related products have been evaluated during past crop assessment surveys and the WRSI product keeps performing well as long as RFE images do not have major errors. The WRSI product also performs well during drought years because the WRSI model is designed to detect early rainfall shortages, pockets of drought, timing of droughts on crop stage, and relative impact of droughts on crop yields.
Photos of crop conditions were also taken during the early-March crop assessment survey. Many of these photos are used later as “training sites” for supervised crop classifications with Landsat imagery. The photos also record the actual crop conditions on the ground and these crop conditions closely correspond to the relative yields and crop conditions illustrated by the WRSI image in Figure 6. For example, the range of crop conditions included bare soils in Hoopstad (Figures 1); severely water stressed crops in Viljoenskroon (Figure 7); crops having small cobs in Mpumalanga and North West provinces (Figure 8); and crop conditions in Standerton being close to average (Figure 9).
Another method to monitor relative crop conditions year-to year is to utilize satellite imagery from the MODIS (Moderate Resolution Imaging Spectroradiometer) sensor onboard NASA’s Terra and Aqua satellites. The USDA/NASA Global Agriculture Monitoring project (GLAM) automatically processes MODIS imagery and generating NDVI (Normalized Difference Vegetation Index) 8-day composites to measure the vegetation’s relative “greenness” or biomass. Current and historical global MODIS-NDVI composites are archived and made readily available by the USDA/NASA GLAM web site.
The global MODIS-NDVI archive at GLAM served as a powerful tool to monitor South Africa’s severe drought during the 2015 planting season. The MODIS-NDVI images in Figure 9 show bare soils in the west during mid-January due to lack of rainfall during the planting season. Also, the NDVI time-series graph for North West province indicates that crops did not emerge until late January 2016 and vegetation biomass remained well below the historical NDVI average to the end of April, 2016 (Figure 10).
Current USDA area and production estimates for grains and other agricultural commodities are available at PSD Online.
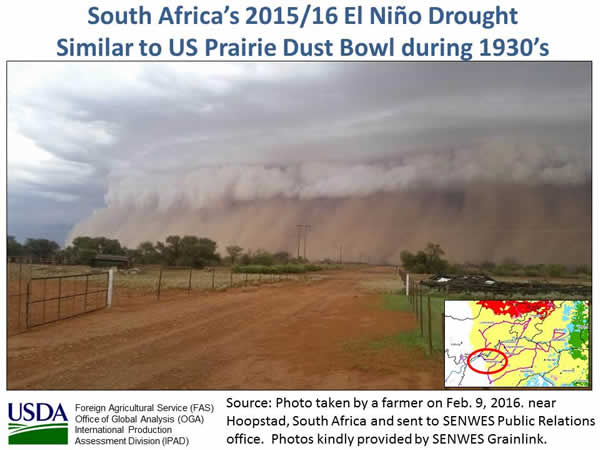
Figure 1. El Niño Induced Dust storms in South Africa (February 9, 2016).
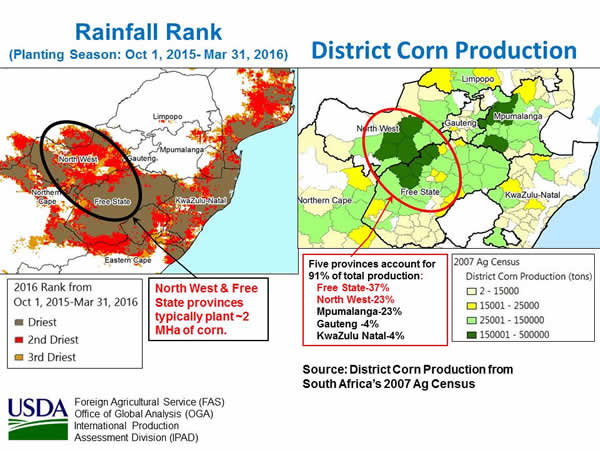
Figure 2. Seasonal Rainfall Rank and District Corn Production for South Africa.
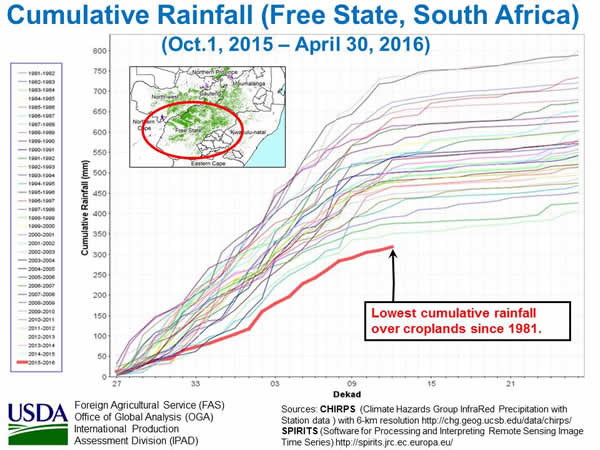
Figure 3. Cumulative Rainfall over Croplands for Free State province, South Africa.
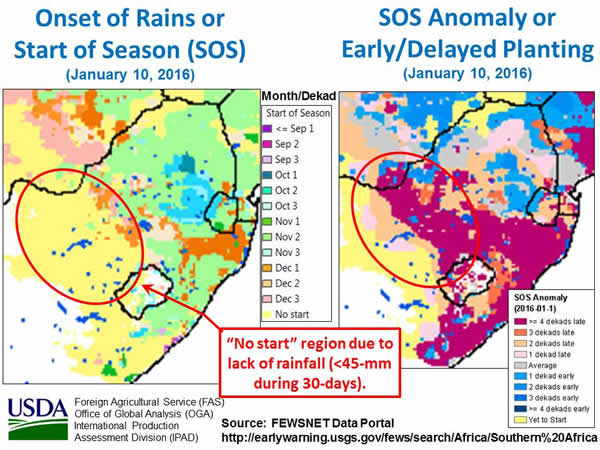
Figure 4. Start of Season (SOS) and SOS Anomaly (i.e., planting delay) in South Africa’s western corn belt.
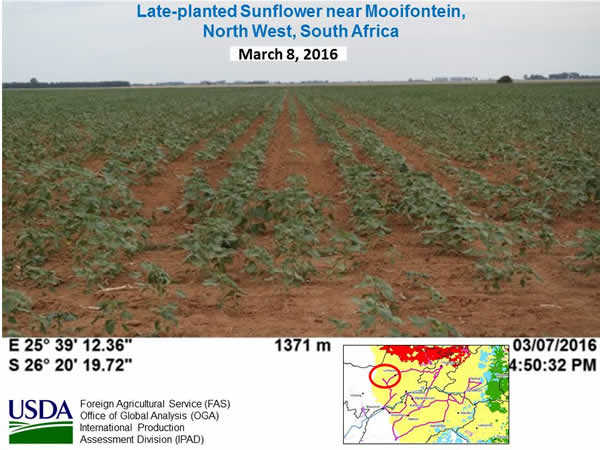
Figure 5. Late-planted sunflower near Mooifontein, North West province, South Africa
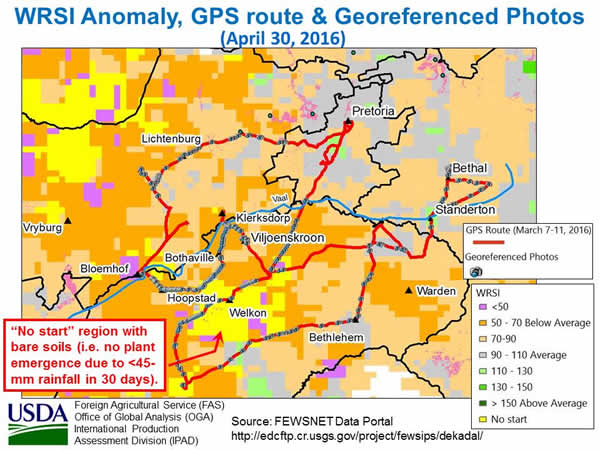
Figure 6. GPS crop assessment route overlad WRSI Anomaly (i.e., relative yield) image.
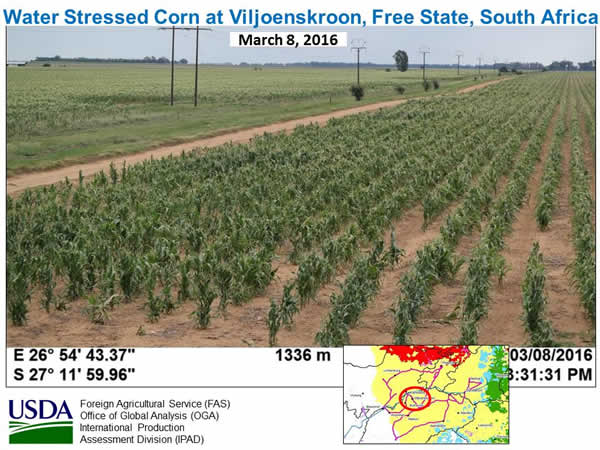
Figure 7. Water stressed corn in South Africa’s Free State province (March 8, 2016).
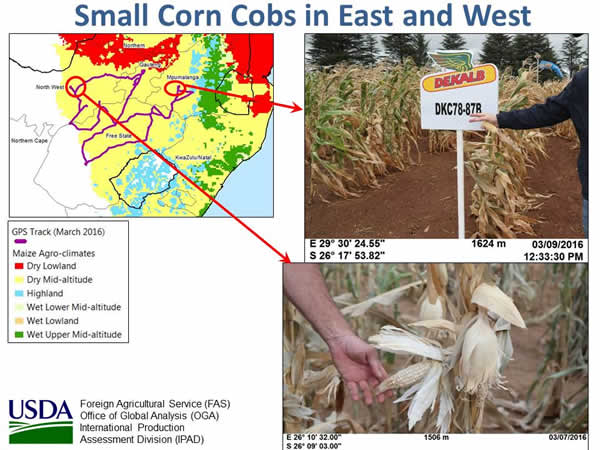
Figure 8. Drought produces small cobs in South Africa’s eastern and western corn belts.
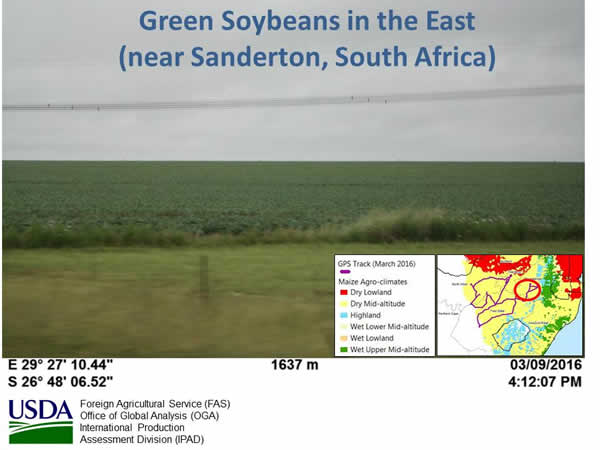
Figure 9. Green fields in the east (near Sanderton, Mpumalanga, South Africa).
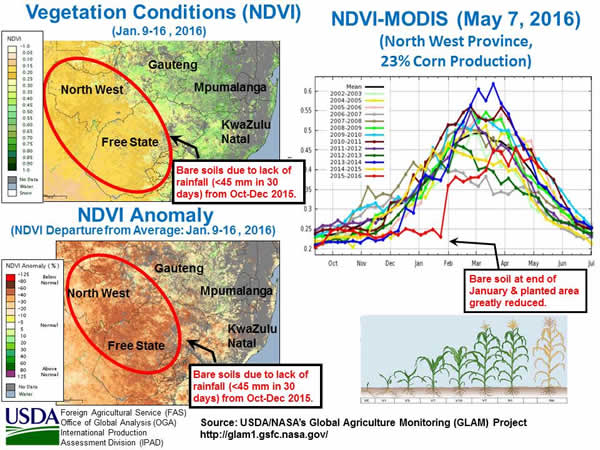
Figure 10. NDVI satellite imagery indicates bare soil in mid-January, 2016 for North West and Free State provinces.
Other FAS Related Links
Commodity Intelligence Reports (CIR) for South Africa with El Niño or La Niña Impacts
Drought Delays 2015/16 Corn Planting in South Africa- November 19, 2015
http://pecad.fas.usda.gov/highlights/2015/11/RSA/index.htm
South Africa faces low corn supply after disappointing seasonal rains-May 2, 2012
http://www.pecad.fas.usda.gov/highlights/2012/05/south_africa/
Severe El Niño Drought Wilts Summer Grain Crops in Southern Africa- May 2, 2007
http://www.pecad.fas.usda.gov/highlights/2007/05/southern_africa_corn_may07/
FAS Annual GAIN report for South Africa’s Grain and Feed (March 24, 2016)
http://gain.fas.usda.gov/Recent%20GAIN%20Publications/Grain%20and%20Feed%20Annual_Pretoria_South%20Africa%20-%20Republic%20of_3-24-2016.pdf
Crop Explorer
http://www.pecad.fas.usda.gov/cropexplorer/
USDA/NASA GLAM (Global Agriculture Monitoring) Project with global MODIS and NDVI Imagery
http://glam1.gsfc.nasa.gov/
G-REALM (Global Reservoirs and Lakes Monitor)
http://www.pecad.fas.usda.gov/cropexplorer/global_reservoir/
PSD Online
http://apps.fas.usda.gov/psdonline/psdquery.aspx
|