El Niño Impacts on 2015/16 Crop Yields
The 2015/16 El Niño was one of the strongest on record and some parts of the world experienced record dryness. In South Africa’s corn belt extreme drought prevented farmers from planting nearly 1 million hectares of corn, and total corn output was reduced by nearly 50 percent from the 5-year average. In contrast, Australia’s wheat belt was expected to experience a drought from the same El Niño, but wheat yield for Australia was close to the 5-year average.
In general, extreme or strong El Niño events in the Pacific can be used to forecast global wet and dry rainfall anomaly patterns, but the predicted anomalies will vary in duration and intensity, with some El Niño years having little impact on crop yields for specific countries (Figure 1). This report briefly reviews extreme El Niño events and their historical impact on crop yields for four different crops in four different countries.
Tools for measuring El Niño strength and corresponding drought occurrence, duration and severity
El Niño and La Niña are measured by the Oceanic Niño Index (ONI), the standard tool used by the National Oceanic and Atmospheric Administration (NOAA) to identify and measure the arrival, duration, and strengths of El Niño (warm) and La Niña (cool) events in the tropical Pacific. The ONI is the three-month mean Sea Surface Temperature (SST) anomaly for the El Niño 3.4 region (located in the Central Pacific).
The historical ONI graph in Figure 2 shows the 2015/16 El Niño as one of the strongest since 1950. Eight strong El Niño’s (1957/58, 1965/66, 1972/73, 1982/83, 1987/88, 1991/92, 1997/98 and 2015/16) and five strong La Niña’s (1955/56, 1973/74, 1975/76, 1988/89, and 1999/2000) have occurred since 1955. These extreme El Niño and La Niña events were compared to historical crop yield statistics in USDA’s PSD Online database to determine whether extreme El Niño and La Niña events correspond to extreme crop yield reductions or increases for specific country/commodity pairs (see discussion below).
Another useful tool for measuring the location, duration and severity of precipitation anomalies is the Standardized Precipitation Index (SPI). This tool was developed primarily for defining and monitoring drought severity, as well as measuring the severity of anomalously wet events. The SPI is useful for determining whether rainfall anomalies are located over major grain belts or prime growing regions during a crop’s growing season (Figure 3). Since El Niño events tend to reach maturity in December (or when ONI values are largest), SPI maps from October through December and January through March are useful for viewing drought severity and spatial extent when ONI values reach near maximum (El Niño) or near-minimum (La Niña) levels.
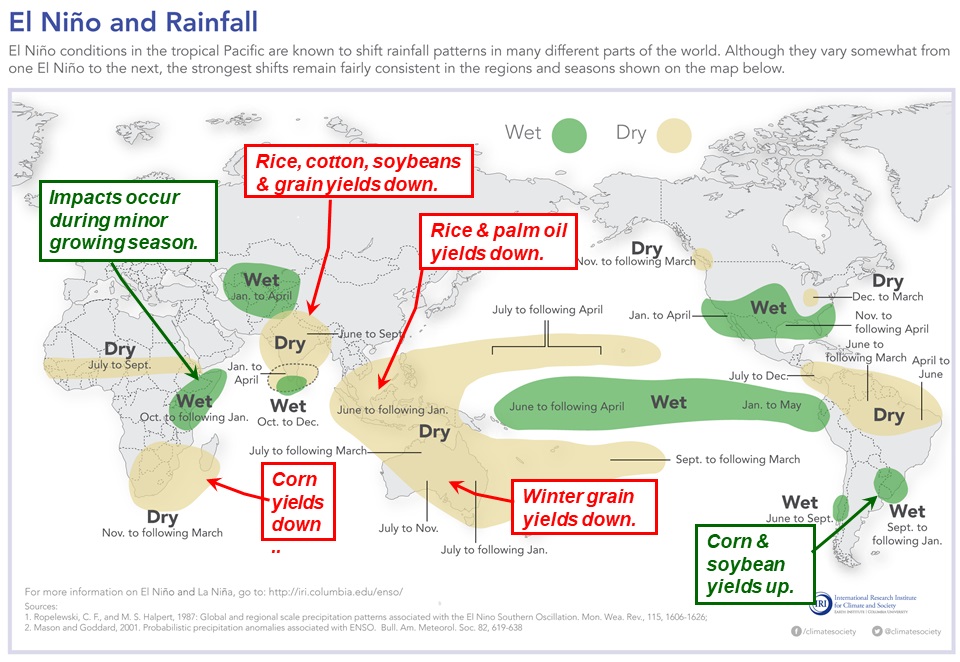
Figure 1. Global El Niño rainfall teleconnections for several selected crops.
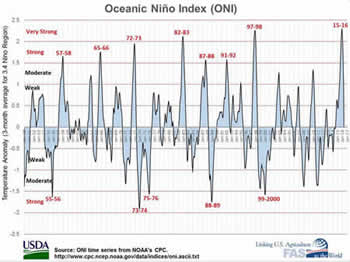
Figure 2. El Niño’s relative strength and duration as measured by the Oceanic Niño Index (ONI) from NOAA.
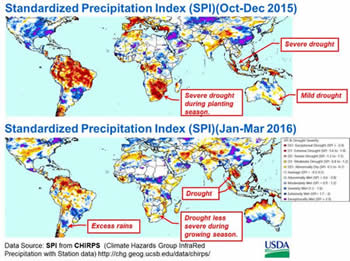
Figure 3. Standardized Precipitation Index (SPI) for three months before and after El Niño’s approximate maturity in December 2015.
USDA’s PSD Online Database
Historical crop yield records from USDA’s PSD Online database were extracted and compared to the extreme El Niño and La Niña events identified by the ONI. The yield departures during extreme El Niño and La Niña events are displayed in Figures 4-7 for four country/commodity pairs: South Africa corn; Australia wheat; Argentina soybeans; and Malaysia palm oil. PSD crop yield data is available for South Africa corn and Australia wheat from 1960 through present, but yield data for Argentina soybeans and Malaysia palm oil is not available for the 1960’s and 1970’s because these crops were not commercially produced at a large scale in Argentina and Malaysia until after 1980.
South Africa Corn
The 2015/16 El Niño reduced South Africa’s corn yield and area by nearly 50 percent from the 5-year average due to a severe drought during the planting season from October through December 2015 (Figures 3 and 4). Rainfall was inadequate for plant emergence during the 2015 planting season and some prime agriculture regions had bare soils in March 2016 when the corn crop should have been two meters high and in grain filling stages (refer to South Africa reports below).
The 1991/92 El Niño induced the largest South Africa corn yield reduction of 64 percent below the 5-year average. The 1991/92 drought, in contrast to the 2015/16 El Niño, was most severe during the crop growth stages from January through March and not severe during the planting season from October through December.
Australia Wheat
Australia wheat yield reductions were minimal during the 2015/16 El Niño, which was due to near-average rainfall occurring over Australia’s major wheat belts during an extreme El Niño event (Figure 2). In contrast, the largest El Niño-induced wheat yield reduction in Australia was 41 percent from the 5-year average which occurred during the 1982/83 extreme El Niño event.
Argentina Soybeans
Argentina’s 2015/16 soybean yields were up by nearly 9 percent from the 5-year average. Soybean yields could have been higher during 2015/16 but excessive rains damaged some of the soybean crop in April 2016 and reduced yields before the crop was harvested. The largest increase in soybean yield was 31 percent from the 5-year average which occurred during the 1997/98 extreme El Niño event.
Malaysia Palm Oil
Malaysia’s palm oil yields for 2015/16 were reduced by nearly 10 percent from the 5-year average which is the largest yield reduction occurring during a strong El Niño event. Rainfall in Malaysia’s prime palm oil growing region was below normal for a 5-month period during the growing season from June through October 2015. The resulting drought stress reduced yields for the 2015/16 marketing year (October 2015 through September 2016). Palm oil yields typically decline 4 to 12 months after a drought stress event has occurred.
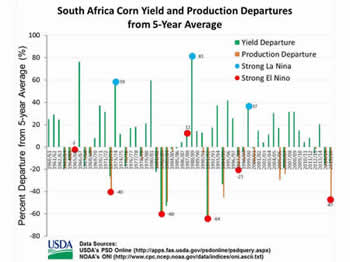
Figure 4. Extreme El Niño and La Niña Events Compared to South Africa’s Corn Yield and Production Departures from the 5-year Average.
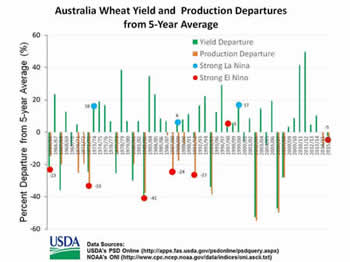
Figure 5. Extreme El Niño and La Niña Events Compared to Australia’s Wheat Yield and Production Departures from the 5-year Average.

Figure 6. Extreme El Niño and La Niña Events Compared to Argentina’s Soybean Yield Departure from the 5-year Average
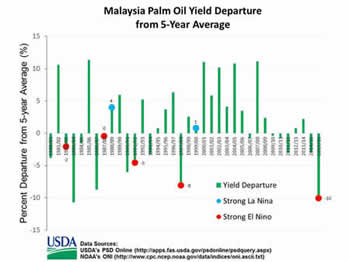
Figure 7. Extreme El Niño and La Niña Events Compared to Malaysia’s Palm Oil Yield Departure from the 5-year Average
In summary, El Niño impacts on crop yields will vary during each El Niño event because each El Niño event varies by duration, strength, timing and spatial extent. In addition, the corresponding drought induced by the events may be mild or non-existent while the corresponding spatial extent of the drought may not be directly centered over major grain belts or prime growing regions. For example, the 2015/16 El Niño induced only mild droughts during Australia’s wheat growing season and these mild droughts were not located over Australia’s major wheat belts. The result was Australia wheat yields for 2015/16 were not affected by one of the strongest El Niño events on record since 1950.
Current USDA area and production estimates for grains and other agricultural commodities are available at PSD Online.
http://apps.fas.usda.gov/psdonline/psdquery.aspx
Other FAS Related Links
Recent Commodity Intelligence Reports (CIR) about the 2015/16 El Niño
El Niño Drought Reduces 2015/16 Corn Prospects in South Africa- May 26, 2016
http://pecad.fas.usda.gov/highlights/2016/05/SouthAfricaElNiño/index.htm
PHILIPPINES: Drought in Mindanao Causes Corn Production Decline- March 28, 2106
http://pecad.fas.usda.gov/highlights/2016/03/Philippines/Index.htm
INDONESIA: Rice Production Prospects Reduced by El Niño -March 9, 2016
http://www.pecad.fas.usda.gov/highlights/2016/03/Indonesia/Index.htm
Argentina Soybeans: Potential Bumper Harvest Could Necessitate Temporary Storage-March 2, 2016
http://pecad.fas.usda.gov/highlights/2016/03/Argentina/Index.htm
INDONESIA: Palm Oil Production Prospects Dampened by El Niño Drought- December 15, 2015
http://pecad.fas.usda.gov/highlights/2015/12/Indonesia/Index.htm
Drought Delays 2015/16 Corn Planting in South Africa- November 19, 2015
http://pecad.fas.usda.gov/highlights/2015/11/RSA/index.htm
Visit Crop Explorer http://www.pecad.fas.usda.gov/cropexplorer/
|