2007 Crop Assessment Tour Summary in Zimbabwe and South Africa
USDA performed a mid-season crop assessment for South Africa and Zimbabwe from February 19 - March 5, 2007, and in cooperation with United States Agency of International Development’s (USAID) FEWS-NET project. The purpose of the trip was to update current crop estimates for both countries and observe how closely various spatial models resemble ground conditions.
The crop tour route for Zimbabwe and South Africa are shown below and over 870 digital photos of crop conditions and landcover were taken. These photos were then georeferenced with Global Postioning System (GPS) data for easy display in ArcGIS mapping software and for archiving year-to-year photos taken in the field. In addition, over 20 farmers were randomly interviewed to determine planting dates and expected yields for the season. This update presents general information related to crop conditions in Zimbabwe, and crop conditions in South Africa are reported in a separate update titled, “Severe El Niño Drought Wilts Summer Grain Crops in Southern Africa”.
Figure 1. 2007 Crop Assessment Route in South Africa and Zimbabwe
Zimbabwe Crop Conditions
In general, start of season rains arrived late by one week or more in the north, and rains were late in the south by one month or more. In addition, the rains were patchy and erratic during the planting season, which required some farmers to plant several times. Draft power also was limited in many regions which extended the planting season window even longer. Correspondingly, the bulk of the crop was planted by the end of December and these late-planted crops were severely affected by extended dry spells from January through March.
Crop conditions north of Harare were more favorable than those in the south (Figure 2), and the best crop conditions were observed in the northeast (Figure 3) where seasonal rainfall amounts were close to average. Drought conditions were especially severe in the south and much of Zimbabwe’s crop in the south had failed by early March. In addition, late-planted crops north of Harare also received below average rainfall in early March when these crops were in critical grain-filling stages.
Figure 2. Relative yield model (WRSI) properly indicated near average crop conditions north of Harare and below average crop conditions south of Harare.
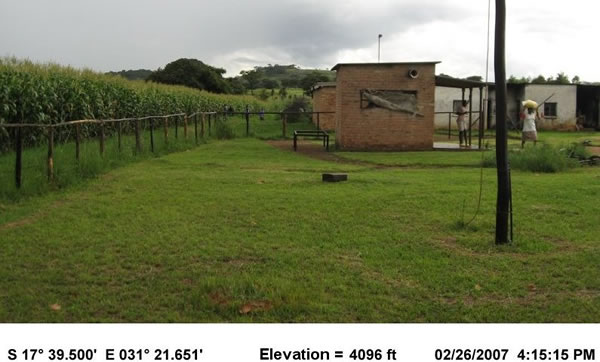
Figure 3. Early-planted corn located northeast of Harare was in excellent condition.
Seasonal rainfall analysis indicates that southern Zimbabwe received very little rainfall during 2007 and total seasonal amounts were as low as the severe drought of 2002. In the northeast, seasonal rainfall amounts were still below average and total seasonal rainfall was close to levels experienced during the 2005 season. Correspondingly, 2007 national yields are expected to be somewhere between the national yields of the 2002 and 2005 seasons, which produced yields of 0.38 and 0.58 tons/hectare, respectively. USDA, therefore, estimated on April 10th a national yield of 0.5 tons/hectare, which is below the 5-year average and slightly less than the 2005 yield of 0.58 tons/hectare (Figure 4).
Figure 4. Historical corn yields in Zimbabwe
Total corn area for Zimbabwe is estimated at 1.2 million hectares, which is 200,000 hectares less than last year and largely due to extensive crop failure in the south and less planted area on the A2 farms (i.e., reallocated farms ranging in size from 80-200 hectares). Many A2 farms continue to remain fallow in Zimbabwe because the new farmers who own these farms are not experienced or they do not want to risk investing their capital on agriculture when the country is experiencing hyper-inflation and inputs such as diesel and fertilizers are so expensive. In addition, limited tractors prevent A2 farmers from planting and many experienced farm managers who could assist the A2 farmers have sought other avenues of employment due to low farm wages. Correspondingly, fewer A2 farms are being farmed each year and the most fertile and productive soils within the country continue to remain fallow and idle year after year.
Finally, USDA’s forecast for 2006/07 Zimbabwe corn production was lowered in April from 850,000 tons to 600,000 tons due to poor rainfall in the northern grain belt during March and extensive crop damage from lack of rains in the south. A crop assessment team from the Food and Agriculture Organization (FAO) and World Food Program (WFP) is expected to assess the crop harvest in Zimbabwe from April 25-May 18 and their report will be released sometime during early or mid-June.
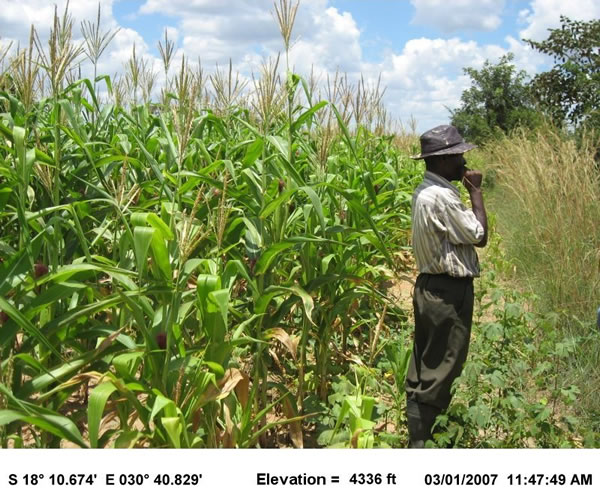
Figure 5. Early-planted corn planted in late-November was able to survive the January-February dry periods due to deep roots utilizing soil moisture (i.e., farm located slightly southwest of Harare) .
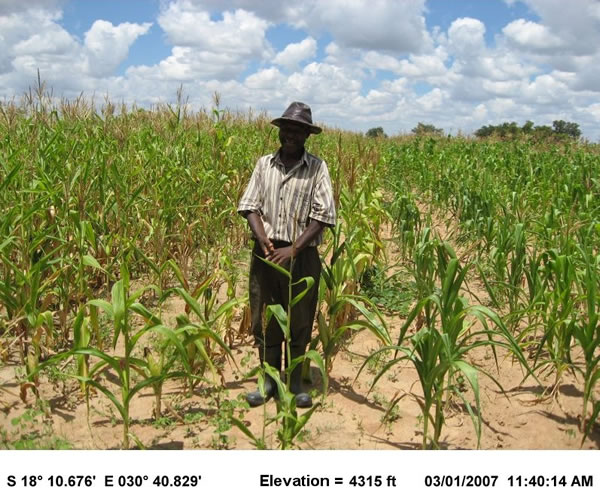
Figure 6. Late-planted corn planted in late-December could not survive dry periods from January through February (i.e., farm located slightly southwest of Harare).
Current USDA area and production estimates for grains and other agricultural commodities are available at PSD Online.
Other FAS Related Links and Images
Food Security Situation in Southern Africa (Mar 14, 2007)
Zimbabwe Monthly Update (April 2, 2007)
Zimbabwe Monthly Update (March 5, 2007)
Crop Explorer for Southern Africa
MODIS (250-meter)/NDVI Time-Series Charts
|