Satellite Imagery Indicates 2009 Corn Area in Zimbabwe Is Less Than Corn Area in 2000
USDA’s Foreign Agricultural Service (FAS) performed a mid-season crop assessment in Zimbabwe from February 23-27 and in South Africa from February 17-20, 2009. The purpose of the trip was to update current crop estimates for both countries and ground truth satellite imagery and various spatial crop models with actual ground conditions. These ground surveys were conducted during mid-season when crop growth is near maximum leaf area index (LAI) for better accuracy in classifying crop types from medium resolution satellite imagery. Crop conditions in South Africa ranged from very good to excellent, and the remainder of this survey report will focus on crop area and crop conditions in Zimbabwe.
The 2009 crop assessment travel in Zimbabwe was conducted in cooperation with the United States Agency of International Development (USAID) in Zimbabwe. The 2009 crop assessment route is shown in Figure 1, where over 750 photos were taken and several farmers were randomly interviewed along the route. The final day was spent in roundtable discussions with representatives from the agriculture industry and interviews with technical specialists from international development organizations.
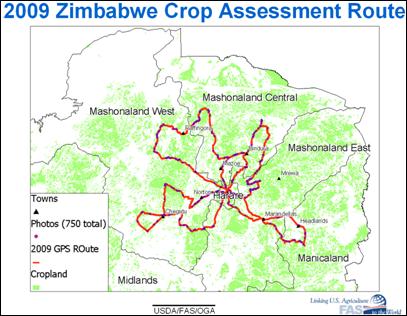
Figure 1. 2009 Zimbabwe Crop Assessment Route
2009 Vegetation Conditions Above-Average, but Estimated Yields Still Below-Average Due to Lack of Inputs and Late-Planted Crops '
In general, seasonal weather during 2008/09 was favorable but rains arrived late for most of the country (2nd dekad of December) and the eastern part of the country experienced a dry spell from the end of January through mid-February. Crop conditions during late-February were observed by the survey team to be dry in the Mashonaland provinces, with late-planted crops in sandy soils showing severe water stress, especially in the eastern part of the country. However, the rains returned in early-March and most of Zimbabwe received normal to above-normal rainfall from March through May.
Seasonal vegetation greenness or vigor as measured by the Normalized Difference Vegetation Index (NDVI) from the MODIS satellite sensor indicates 2008/09 growing was one of the best years in the past five-years. The analog year, or similar year with similar vegetation health is the 2003/04 growing season and two 2003/04 NDVI temporal profiles from Midlands and Mashonaland East provinces are shown in Figure 2. In summary, the MODIS/NDVI time-series charts in Figure 2 indicate a late start of the season for 2008/09 with vegetation vigor or conditions above-average during mid-season or the critical grain-filling stages from March-April. However, even though the MODIS/NDVI seasonal time-series profiles or vegetation conditions were above-average during the 2008/09 growing season, other non-weather factors greatly reduced potential corn yields in Zimbabwe.

Figure 2. NDVI-MODIS Time-series Graphs
Several non-weather factors that reduced yields in Zimbabwe are cited in the First Round (February 27th, 2009) and Second Round (April 28th, 2009) Crop and Livestock Assessment Reports by Zimbabwe’s Department of Agricultural Technical and Extension Services (AGRITEX). For example, 2008/09 basal and top-dressing fertilizer inputs were reported to be less than the previous crop year (2007/08) by 51% and 68%, respectively. Other non-weather problems cited by AGRITEX include: high prices and critically short supply of seeds, fertilizers and fuel; large tracts of fallow land within the A2 (i.e., 50-200 hectares) farms and large-scale commercial areas; approximately 13,000 MT of seeds available or 48% less seeds available than the previous year; 66% of the seeds were from carry-over stocks, grain from food aid, or purchased from other outside sources; and late delivery of inputs from input support programs (i.e., seeds arrived after the optimal planting window).
Several other critical non-weather factors the First and Second Reports failed to mention include:
- “Dollarization” or the switch to multiple foreign currencies as legal tender (i.e., US dollars, South African Rand, Botswana Pula, or the Euro) during the 2008 planting season prevented many farmers from planting crops as they did not have dollars or rand to purchase seeds when the previous year’s crop was sold in Zimbabwe dollars. (refer to dollarization article).
- Zimbabwe’s seed production capacity has been severely affected during the past nine years and only 15 percent of the national seed requirements were produced for the 2008/09 growing season.
- Many seeds did not germinate or are inappropriate for the respective agro-climatic zones.
- Seeds delivered late are often eaten due to hunger and not stored for later growing seasons.
- Greater efforts to revive Zimbabwe’s seed production potential should be addressed, as well as open markets for international seed companies to supply the shortfall in seeds.
- Numerous irrigation systems for seed production are in disrepair and Zimbabwe requires more experienced farmers with irrigation systems who can produce high quality hybrid seeds.
- Fertilizer production is at 20% capacity and soils have not received lime treatment for many years. Zimbabwe's national fertilizer industry needs to be revived and input support programs should consider providing lime to help reduce soil acidity.
In short, Zimbabwe 2008/09 corn yields were below 1 ton/hectare due to a shortage of inputs, even though seasonal NDVI values were above-average and vegetation health was one of best during the past five-years for most provinces.
“Fast Track” Land Reform Nearly Halts Seed Production in Zimbabwe
Zimbabwe’s farming sector has undergone radical changes from 2000-2009, largely after the “fast track” resettlement program was announced on July 15, 2000 and many large-scale commercial farms were often violently overtaken and converted into A1 (small-scale or 5-25 hectares) and A2 (medium to large-scale or 50-200 hectares) farms. Zimbabwe’s largest seed supplier and producer of corn seed is Seed Co. which once produced approximately 36,000-40,000 tons of corn seed, prior to 2000, by a network of approximately 200 large-scale commercial farmers. However, Seed Co. in 2008 could only produce 6000 tons of seed (or 15% of previous capacity in 2000) and 37% percent of their contract seed growers did not achieve yields greater than 1 ton/hectare when their traditional average was 4.5 tons/hectare (see Figure 3).
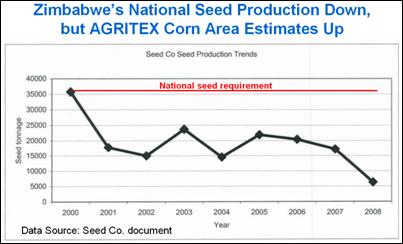
Figure 3. Seed Production in Zimbabwe Decreases from 2000-2008 (from Seed Co.)
Due to the lack of in-country seed production, obtaining hybrid seeds on the open market has become such a problem that almost every farmer reports difficulties in buying seeds and many farmers therefore must rely on seeds from input seed programs or plant open-pollinated varieties (OPV) with lower yield potential. Farmers also report eating seeds freely distributed from various international donors or the Government of Zimbabwe (GoZ) input programs because these seeds are delivered too late during the current season and hunger prevents them from keeping the seeds in storage for the next growing season. Many farmers also report they bought poor quality seeds that did not germinate and they had to replant later in the season.
In addition to a national seed shortage, many of the A1 and A2 farms are fallow in Zimbabwe due to other reasons such as new farmers who own these farms are not experienced or the new owners do not want to risk investing their limited capital on agriculture when the country is experiencing hyper-inflation and farm inputs such as diesel and fertilizers are so expensive. Limited tractors also prevent the larger A2 farmers from planting larger tracts of fields and many experienced farm managers who could assist A2 farmers have sought other avenues of employment due to low farm wages. The final result is large tracts of land have been left fallow for several years and it’s now becoming difficult to discern former commercial fields as these once productive agriculture fields revert to native vegetation and bush.
2009 Satellite Imagery Indicates Numerous Late-Planted Fields and Fallow Fields Due to Severe Seed Shortage and Other Problems
FAS, in cooperation with USAID, has conducted similar mid-season crop assessments in Zimbabwe during February 19-24, 2006 and February 26- March 1, 2007. Digital photos were taken during the previous assessments to document the crop conditions and cropland type. These field photos are georeferenced by joining the photo’s time stamp to the track log from a Garmin Global Positioning System (GPS) and by utilizing the GPS-Photo Link software from GeoSpatial Experts. These georeferenced photos are easily displayed in Google Earth or in ArcGIS mapping software, and these photos are archived for year-to-year comparisons.
For example, Figure 4 shows a late planted crop at the end of December 2008 (bottom photo) in comparison to the same farm with a bumper crop planted in mid-November, 2006 (upper photo). Onset rains for the 2008/09 growing season reportedly arrived on time but the farmer planted late (i.e., on December 25th) due to the lack of seeds and fertilizers, and not due to lack of rainfall. Figure 4 also illustrates how planting a crop in Zimbabwe during late-December or early-January greatly reduces potential yields.
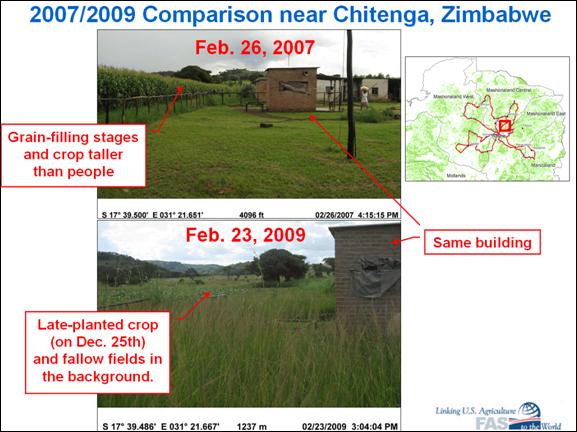
Figure 4. Late-planted Crop due to Lack of Seeds
During previous 2006 and 2007 Zimbabwe crop surveys conducted by FAS and USAID, large amounts of cropland were observed fallow and fallow land appeared to have increased in 2009 due to the lack of inputs such as seeds and fertilizers (refer to FAS Zimbabwe GAIN reports December 17, 2008 and February 9, 2009). In efforts to quantify planted corn area and whether it has increased or decreased since 2000, the Office of Global Analysis (OGA) within USDA/FAS contracted GDA Corp to process mid-season (i.e., January-April) satellite imagery during 2000 and 2009 and to classify all corn fields within in the images. The satellite imagery coverage is shown in Figure 5 where the Landsat-7 imagery in 2000 covered most of the country; Landsat-7 imagery in 2009 had only partial coverage; and AWIFS (Advanced Wide Field Scanner) imagery in 2009 had complete coverage.
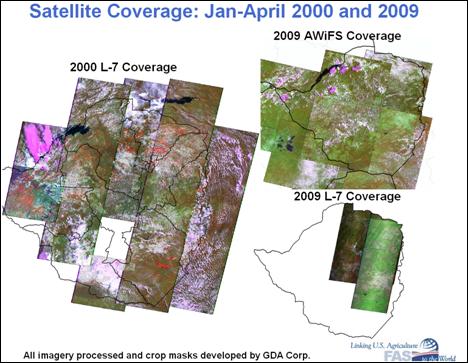
Figure 5. Landsat-7 and AWiFS Satellite Coverage during Zimbabwe’s Crop Season
Landsat-7 images are currently available free-of-charge but Landsat-7 images collected after May 31, 2003 have black stripes caused by the Scan Line Corrector (SLC) failure on the ETM+ sensor (see Figures 6-8). The net effect is Landsat-7 images from June 2003-to-current are acquired in the SLC-off mode, with approximately one-quarter of the image missing data caused by missing scan lines. A replacement Landsat-8 satellite is scheduled to be launched on December, 2012. FAS plans to purchases AWiFS imagery from the Indian Remote Sensing (IRS) P6 (RESOURCESAT-1) satellite to act as a “bridge” for the data gap between the Landsat-7 and Landsat-8 missions.
The technical specifications between Landsat-7 and AWiFS imagery are slightly different with Landsat-7 imagery having 30-meters spatial resolution and a swath width of 185-kilometers, while AWiFS imagery has 56-meters spatial resolution at nadir (approximately 70-meters off-nadir) and a swath width of 737-kilometers. Therefore, the coarser AWiFS 56-meter spatial resolution makes it more difficult to classify smaller fields in Zimbabwe but AWiFS advantages include a larger swath width and greater repeat cycle than Landsat-7. The repeat cycle for Landsat is 16-days, while the AWiFS repeat cycle is 5-days in theory but slightly more in practice. The better repeat cycle and larger swath width for AWiFS explains why AWiFS coverage in 2009 is more complete and thorough than Landsat-7 coverage during 2000 and 2009.
The Landsat-7 images collected in the SLC-off mode were still useful in detecting field partitions between 200 and 2009, and late-planted crops in Zimbabwe during January 2009. For example, Landsat-7 imagery easily detected significant field partitions in Zimbabwe between 2000 and 2009 and Figures 6-8 also show where nearly 50 percent of 2009 crop was planted late (in January), as indicated by the bare soil in the January Landsat-7 and AWiFS images. These imagery results indicate that AGRITEX's First Round Report is probably optimistic to state that 18% of the crop was planted late (in January) when both Landsat-7 and AWiFS imagery show nearly 50% of the crop was planted late (in January) by the presence of bare soils in mid-January images.
In addition, the 2009 satellite imagery shows where former 2000 cropland has been fallow for several years and water pan surface areas havebeen significantly reduced. These smaller water pans are probably not due to lack of rain, but due to large-scale farms being divided into smaller parts, and making it more difficult to preserve and maintain former rain catchments and irrigation systems that once served larger commercial farms.
In summary, results from the satellite imagery analysis indicated the trend is negative for Zimbabwe’s corn area from 2000 to 2009 and not positive as indicated by the 2009 AGRITEX First and Second Round reports. It also seems unlikely that Zimbabwe’s corn area increased from 2000 when Zimbabwe’s national seed production has decreased by 85 percent since 2000; fields have been fallow for several years especially in the A1 and A2 farming sectors; and the national agricultural economy has virtually collapsed.
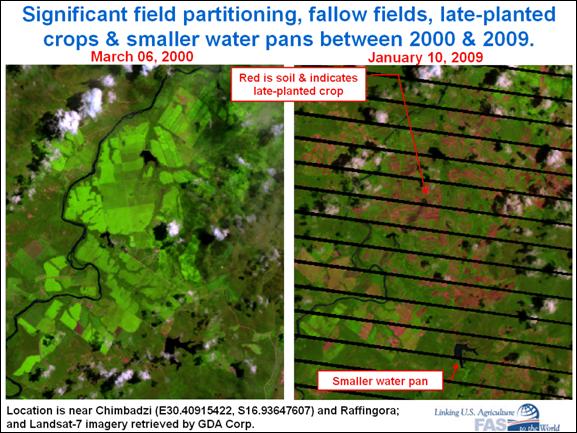
Figure 6. Satellite Imagery Indicates Late-Planted Crop in 2009
and Reduced Planted Area between 2000 and 2009.
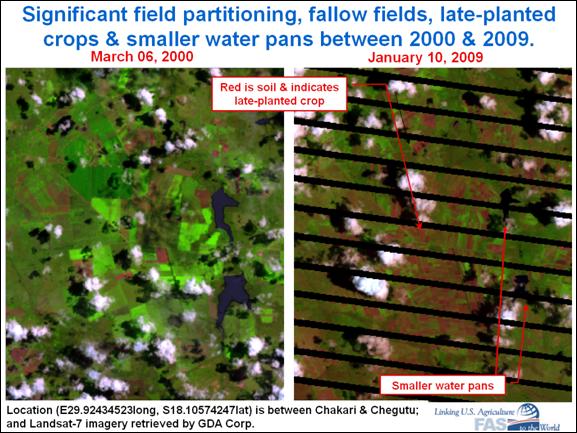
Figure 7. Satellite Imagery Indicates Late-Planted Crop and Smaller Water Pans in 2009.
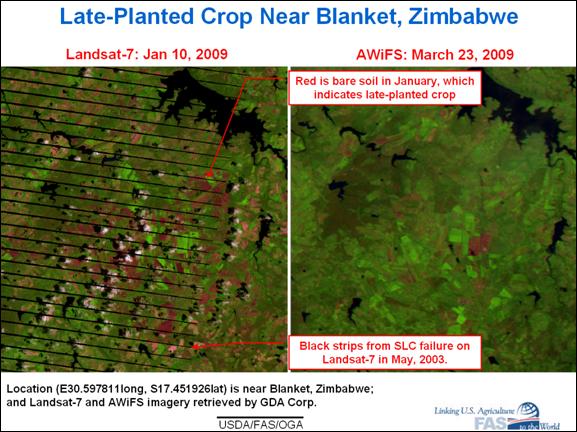
Figure 8. Late-Planted Fields Detected by Landsat-7 Imagery (with SLC-Off) and AWiFS.
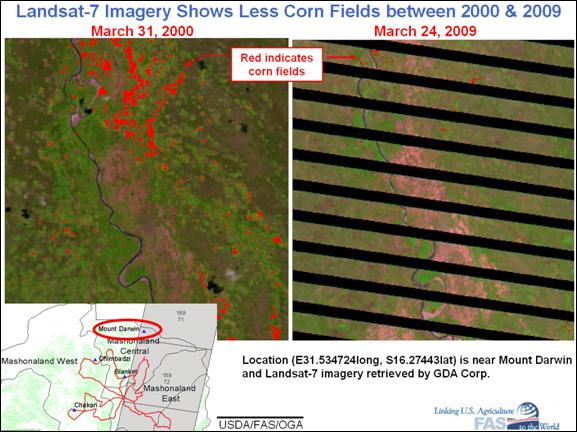
Figure 9. Less Corn Fields Identified between 2000 and 2009 Landsat-7 Imagery.
Satellite-Derived Corn Area Comparisons between 2000 and 2009
All Landsat-7 (2000/2009) and AWiFS (2009) images shown in Figure 6 were processed by similar crop area classification algorithms by GDA Corp, whereby all cropland pixels containing corn were classified or identified. Corn area statistics were then extracted from the satellite imagery by treating all SLC-off stripes as clouds and extracting statistics for provincial administration units and farm class polygons. The crop statistics extracted from these satellite images are helpful in detecting the percent change in corn area from 2000-2009 but do not provide total corn area within provinces because clouds and SLC-off stripes prevent complete coverage over a province or the entire country.
The corn area percent change results derived from satellite imagery during 2000 and 2009 are presented in Tables 1 and 2. It should be noted that Table 1 utilized 2001 provincial corn area data as reported by the FAO Crop and Food Supply Assessment Missions (CFSAM) report because 2000 provincial data was not available. However, 2001 provincial corn area can be assumed to be approximately the same as 2000 because AGRITEX estimated national corn area in 2000 at 1.373 million hectares and 1.240 million in 2001 (similarily, USDA’s PSD Online 2000 and 2001 corn area estimates are 1.417 and 1.223 million hectares, respectively).
The corn area estimates derived from satellite imagery indicate planted corn area decreased in most provinces from 2000-2009, with the exception of a 10 percent increase in the outskirts of Harare and one percent increase in Mashonaland East province. These results differ with AGRITEX ground samples that indicates corn area increased from 2000 to 2009 for all provinces except for Mashonaland West (2% reduction) and Matebeleand North (10% reduction) provinces, refer to Table 1.
Pixels identified as corn area were also extracted from the 2000 and 2009 satellite imagery based on farm class, where farm class is defined by the shapefile polygons shown in Figure 10. The corn area by farm class results are presented in Table 2 and indicate corn area from 2000-2009 did not increase for any farm class, with total 2009 corn area decreasing nationwide (as covered by satellites less clouds) by 30 percent from 2000. A 30 percent reduction from 1.373 million hectares in 2000 would imply 2009 total corn area in Zimbabwe is approximately 950,000 hectares.
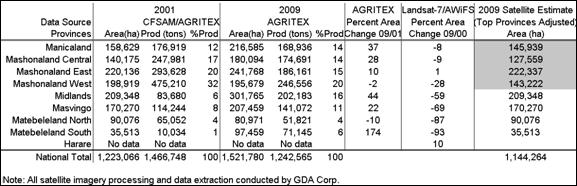
Table 1. Percent Change in Area According to Satellite Estimates and AGRITEX
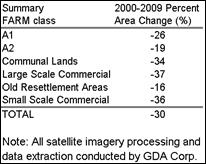
Table 2. Farm Class Percent Change in Area from 2000-2009 (Satellite Estimates)
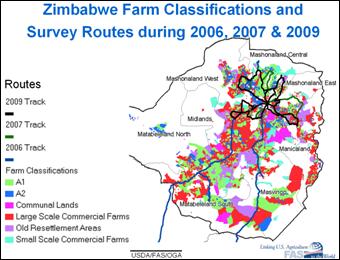
Figure 10. Zimbabwe Farm Classifications and Survey Routes during 2006, 2007, and 2009
Conclusions: Zimbabwe's Corn Area Trend Decreases from 2000-2009
A combination of field observations, satellite imagery for 2000 and 2009, and seed production data from 2000-2009 indicates that Zimbabwe’s corn area has decreased over the past nine years rather than increased as stated by AGRITEX Second Round reports in April 2008 (area = 1.72 million hectares) and April 2009 (area = 1.52 million hectares). Processed satellite imagery indicates corn area is approximately 30% less nationwide from 2000-2009. In addition, all farming sectors indicate less corn area from 2000-2009, with large scale commerical farms showing the greatest reduction in area (-37%) and old resettled farms showing the least amount of corn area reduction (-16%). These downward trends in corn area from 2000-2009 tend to agree with the severe national seed shortage over the past several years and shortages of many other inputs such as fuel, fertilizers, and tractors.
Yield estimates by AGRITEX's Second Round Report also seem optimistic, with 2008/09 corn yield estimated at 0.82 tons/hectare and last year's yield in the Second Round report at 0.27 tons/hectare, or more than three-fold increase in yield from the previous year. In general, seasonal NDVI or vegetation vigor was better than last year but potential yields were still hampered by poor seed quality; fertilizer applications were 50% less than the previous year; and nearly 50% of the fields in 2009 were planted late (or in January as detected by satellite imagery). Therefore, USDA's current 2008/09 yield estimate is less optimisitic, with this year's yield estimated at 0.44 tons/hectare and the previous year estimated at 0.40 tons/hectare.
Finally, poor seed quality and very low seed production is a major problem in Zimbabwe and the shortage of all inputs such as seeds, fertilizers, lime, pesticides, diesel, etc. need to be addressed to reduce Zimbabwe’s chronic food insecurity problem. The lack of fertilizer and seeds prevented Zimbabwe from reaching their national grain demand in 2009 even though 2008/09 vegetation vigor was the best in five-years for most provinces. If Zimbabwe desires to be food self-sufficient again, they urgently need to address their national seed and fertilizer production shortfalls, as well as address why prime cropland located within the former grain basket continues to remain idle year after year.
Final Technical Note:
It appears daily station rainfall data from Zimbabwe and delivered to the World Meteorological Organization (WMO) was under-reported during 2009 and therefore 2009 WMO rainfall data should be considered incomplete. Due to the reporting problem with WMO data from Zimbabwe, the best spatial data set for comparing different growing seasons from 2000-current appears to be the MODIS (250-meter) NDVI time-series data made available by USDA/NASA. Figure 2 presented two MODIS/NDVI time-series charts for Mashonaland East and Midlands provinces and other time-series charts for other provinces can be retrieved at USDA/NASA GLAM (Global Agriculture Monitoring) web site.
Other FAS Related Links and Images
USDA/FAS Zimbabwe GAIN Report (February 9, 2009)
USDA/FAS Zimbabwe GAIN Report (December 17, 2008)
PSD Online
USDA/NASA MODIS (250-meter)/NDVI Time-Series Charts
Crop Explorer for Southern Africa
USDA/NASA Vegetation Index Monitor
2007 Crop Survey: Crop Assessment Summary in Zimbabwe and South Africa
2006 Crop Survey: La Nina Delivers Wet and Cold Weather to South Africa’s Corn
Reference to Other Baseline Documents
AGRITEX First Round Crop and Livestock Assessment report (February 27th, 2009)
AGRITEX Second Round Crop and Livestock Assessment report (April 28, 2009)
2001 FAO Crop and Food Supply Assessment Missions (CFSAM)
GPS Photo Link Software
Drought Prone Areas of Zimbabwe
Dollarization in Zimbabwe
Summary Figures and Tables from Above Report
Current USDA area and production estimates for grains and other agricultural commodities are available on IPAD's Agricultural Production page or at PSD Online.
|