Data Sources
(Further description of products, acronyms and references are provided in the conference paper shown below.)
United States Department of Agriculture (USDA), Foreign Agricultural Service (FAS),
Global Market Analysis (GMA) Submitted to the Third International
Conference on Geospatial Information in Agriculture and Forestry,
Denver, Colorado, November 5-7, 2001
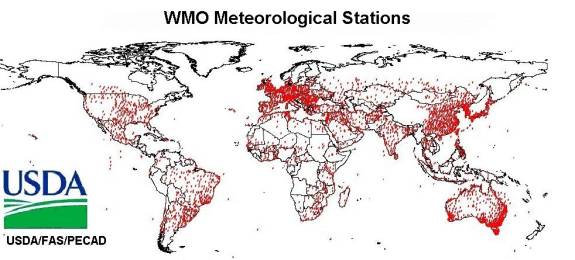
GMA/IPAD relies on several different data sources to monitor weather anomalies that affect crop production and quality of agricultural commodities. The two main agrometeorological input data sources are:
Both these data sets are entered and stored in GMA/IPAD’s CADRE (Crop Condition Data Retrieval and Evaluation) database management system (DBMS) on a daily basis. After the agrometeorological data is downloaded, several data extraction routines are executed to display the following spatial data for different regions in the world:
In addition, several crop models and data reduction algorithms are executed for both the station and satellite agrometeorological data sets. These models include crop calendars, crop hazards, and several different crop yield reduction models to assess crop conditions. Most of these crop models and computer tools were developed by researchers from various U.S. universities, government agencies, and private contractors. Most of these models use daily potential evapotranspiration (PET) which is first calculated from minimum and maximum temperatures and station location (latitude, longitude, and elevation) according to the FAO 56 Penman-Monteith equation (Allen, et al, 1998). Precipitation, PET, and soil water-holding capacity are then utilized to run a two-layer soil moisture model within in CADRE to estimate:
Many of the data sets produced by the crop models are not yet on-line, but GMA/IPAD in the near future plans to provide output data from these models. Future output products provided by GMA/IPAD will include the following:
Over the past twenty years, most of these agrometeorological variables and crop models were not made available to the public. However, current efforts are being made to display these spatial databases on a nearly real-time basis (every ten-days). The maps and graphs provided are specifically designed to monitor adverse weather conditions over the main agriculture regions in the world. Regional GMA/IPAD analysts then utilize this agrometeorological data, other high-resolution satellite imagery, FAS attaché crop reports, in-county sources, wire services, and personal knowledge to estimate national crop production by the 12th of each month. Some basic information about the agrometeorological input data, climate normals, crop models, and data extraction routines are described below.
USDA’s Joint Agricultural Weather Facility (JAWF) receives the WMO station data from NOAA and provides GMA/IPAD with the following daily station data:
After downloading the WMO station data, GMA/IPAD then runs additional data reduction algorithms, soil moisture, crop stress, and relative crop yield reduction models, as well as CADRE extraction routines for the station data. The station data and output products are then compared to the satellite data to screen the satellite and station data sets for obvious errors.
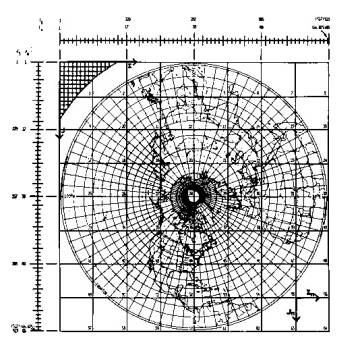
The coordinate system for the 1/8-mesh grid cells is a 512 by 512 grid laid on a polar stereographic projection for the northern and southern hemispheres (refer to Figure 2). The projection is true at 60-degree latitude, with the grid cell resolution ranging from 51-km at the poles to 25-km near the equator. More information on the 1/8-mesh grid reference system can be found in Hoke, et al., (1981).
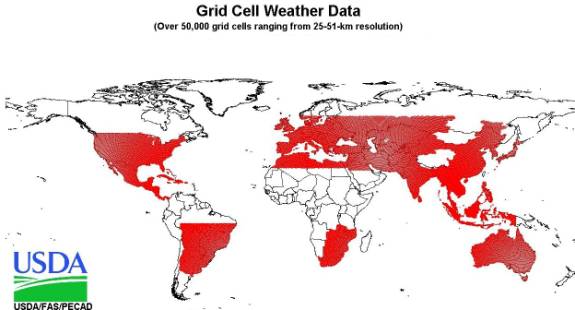
The agrometeorology data sets downloaded daily for the grid cells in Figure 3 include the following:
The references for derivation of these agrometeorological variables are indicated above. After downloading the above agrometeorology data sets, soil moisture, crop stress, and relative crop yield reduction models as well as CADRE extraction routines are executed to display the various maps and graphs on the Internet. The current global precipitation is estimated by blending four different data sources together. The SSM/I (Special Sensor Microwave /Imager) is the first source. Rain rates are formulated from the brightness temperatures as documented by Hollinger (1989). The second source uses the Real Time Nephanalysis Cloud Model (RTNEPH) described by Kiess and Cox (1988). The third and final data sources utilize WMO ground station data and geostationary satellites.
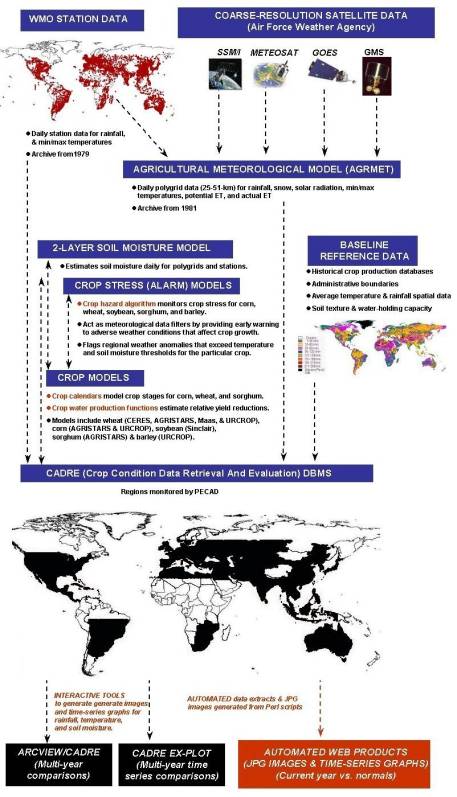
Twenty years ago, the original developers of CADRE had a unique geospatial vision although FORTRAN card readers were still used, storage capacity of computers were limited, and GIS (Geographic Information Systems) software were not yet available. CADRE’s current DBMS is essentially the same DBMS of twenty years ago. A flow chart of CADRE’s data stream is shown in Figure 4. Changes in operating systems and upgrading the baseline datasets are the main differences between the CADRE’s old and current systems. For example, CADRE was originally loaded in a DEC mainframe, later transferred to a DEC VAX system, and currently resides on a DEC UNIX server. Switching to different operating systems also entailed converting CADRE’s data archive, data extraction routines, and crop models into different operating environments. The latest switch to a UNIX environment made it possible to display output data from CADRE on the Internet and on a nearly real-time basis (every ten days).
The most recent upgrades to CADRE involved transferring new digital baseline databases developed by other agencies into CADRE’s 1/8-mesh grid reference system. For example, monthly grid cell normals for rainfall and temperature were recently extracted and imported into CADRE by utilizing the Leemans and Cramer (1991) 16-bit global climate images. These images also are available in 8-bit format from the FAO Climate Maps. These grid cell normal values are utilized in the precipitation and temperature time series graphs provided on-line by GMA/IPAD. Other baseline normal data sets were improved by incorporating monthly station normals (from 1960-1990) provided by the WMO and NOAA. The soil water-holding capacities in CADRE were also upgraded by extracting values derived by the FAO (1996) Digital Soil Map of the World (DSMW). In addition, elevation and monthly potential evapotranspiration normals for the grid cells were derived from digital datasets developed by Row and Hastings (1997), and Ahn and Tateishi (1994), respectively. Crop information within CADRE was also updated by compiling provincial crop yield and production data for most countries monitored by GMA/IPAD. Administration units at level-2 were utilized to store historical crop information because most national crop statistics are reported at this scale. These national crop statistics were then converted into ARCVIEW shape files and imported into CADRE’s 1/8-mesh grid cell format. Crop information updates are continuously required (average yield over the last five years) in efforts to make the relative crop yield reduction models more effective.
The original soil moisture and crop models used by CADRE began development in 1978 and were implemented by the AgRISTARS program in the early 1980s, (Boatwright and Whitefield, 1986). These models are FORTRAN programs which extract daily station and gridded agrometeorological data described above. Personnel from the USDA, NOAA, NASA, and private contractors wrote the original crop models. The initial focus of crop model development was for the U.S. and Former Soviet Union (FSU). However, many of these models are currently being expanded for other counties throughout the world. The two-layer soil moisture
algorithm developed by the AgRISTARS program is the backbone algorithm that runs
the crop calendar (growth stage) and crop stress (alarm) models. The two-layer soil moisture model is a bookkeeping method that
accounts for the water gained or lost in the soil profile by recording the
amount of water withdrawn by evapotranspiration and replenished by
precipitation. The final aim of the soil moisture model is to estimate if soil
moisture storage between dry spells was adequate for maximum plant growth. Crop calendar models developed by the AgRISTARS program are accretion models that model the crop growth incrementally, based on growing degree-days (or thermal units) for several different types of crops and crop varieties. The crop calendar is a growing degree-day algorithm that uses daily minimum and maximum temperature measurements, as well as threshold temperatures defined by the particular crop type. The current crop calendar models are initialized by average start of season data derived from national crop reports. Future efforts will be made to initialize the crop models from start of season data derived from agrometeorological data or vegetation index numbers (VIN) stored in CADRE. The VIN database in CADRE is derived from the red and near-infrared channels from the NOAA-AVHRR satellite series as described by Bethel and Doorn, (1998). Crop-stress models developed by the AgRISTARS programs use both the soil moisture and crop calendar algorithms, as well as a hazard algorithm to alert analysts of abnormal temperature or moisture stresses that may affect yields. These hazard algorithms are based on temperature and soil moisture thresholds known to be outside the optimal range of growing conditions and which may cause crop damage at various crop stages. For example, optimal growing conditions for corn is critical during the reproductive phase and the soil moisture and temperature thresholds are most sensitive during this stage. Therefore, if the plant experiences extreme water deficits or temperature conditions during the reproductive phase, the alarm model alerts the analysts of the crop stress in the region. In addition, new crop models are constantly reviewed for possible integration into the operational systems of CADRE. For example, other crop models written by USDA and university researchers have been modified to run specifically from CADRE input data. In these cases, GMA/IPAD has work directly with the author of the crop model so that the model is running in-house with CADRE input data. These in-house models need a full growing season to get results and analysts will not use the models unless they feel the model agrees with ground conditions. Most yield reduction models used by GMA/IPAD were written by other individuals outside of the AgRISTARS project and their models were customized to run from agrometeorological data extracted from CADRE. Yield reduction models begin with the assumption of perfect conditions and decrease yield predictions based on crop stresses. The goal of these crop models is to provide a yield estimate quantified as tons per hectare. Most of these models have a crop water production function algorithm which compares the crop yield with optimal water requirements to the actual water (rainfall) received by the crop. Since no model is correct at all times for all geographic areas, analysts often run several models at once to reduce reliance on one particular model. The most recent trusted yield reduction models (used for lock-up analysis) are the Sinclair soybean (Sinclair, et al, 1991) and CERES wheat models (Richtie, et al, 1998). Of course, other information from other sources such as satellite imagery, in-county sources, FAS attaché reports, wire services, and personal knowledge are also used to decide how adverse weather conditions might have a significant impact on crop production.
The most recent additions to CADRE have been introducing JAVA and PERL extraction routines to automatically generate maps and graphs. These images are then displayed on the Internet and are automatically updated on a dekadal basis. These improvements should allow more users and professionals (both inside and outside of GMA/IPAD) to view CADRE’s invaluable agricultural monitoring data sets. On-going modifications include upgrading all crop models for global coverage because many of the original crop models were only designed for a few specific countries. The final result will be an upgraded geospatial information system with global coverage that will display agrometeorological and crop monitoring information on a nearly real-time basis. In summary, CADRE is a geospatial DBMS which stores numerous data sets and performs various modeling functions. A brief list of input data, climate normals, crop information and models, and data extraction routines performed within CADRE include: Time-series data sets
Normal baseline data sets
Crop Information and Models (for wheat, corn, and soybeans)
CADRE extraction routines
Ahn C.-H. and R. Tateishi. 1994. Development of a Global 30-minute grid Potential Evapotranspiration Data Set. Journal of the Japan Soc. Photogrammetry and Remote Sensing, 33(2): 12-21. Allen, R. G., L.S. Pereira, D. Raes, and M. Smith. 1998. Crop evapotranspiration; Guidelines for computing crop water requirements, FAO Irrigation and Drainage Paper 56, pp. 27-65. Bethel, G. and B. Doorn, 1998. USDA Remote Sensing Technical and Systems Support for Operational Worldwide Agricultural Analysis, 1st International Conference: Geospatial Information in Agricultural and Forestry, Disney’s Coronado Springs Resort, Lake Buena Vista, Florida, USA, 1-3 June 1998 Boatwright, G.O. and V.S. Whitefield. 1986. Early Warning and Crop Condition Assessment Research. IEEE Transactions on Geosciences and Remote Sensing. Vol GE-24, No 1., January. Cochrane, M.A. 1981. Soil Moisture and Agromet Models, Technical Report, USAF Air Weather Service (MAC), USAFETAC, Scott AFB, Illinois, TN-81/001, March 1981. Ek, M., and L. Mahrt, 1991. OSU 1-D PBL Model User's Guide. A one-dimensional planetary boundary layer model with interactive soil layers and plant canopy. Version 1.0.4. March 1991. Dept of Atmospheric Sciences, Oregon State University. FAO. 1996. The Digitized Soil Map of the World Including Derived Soil Properties, CD-ROM, Food and Agriculture Organization, Rome. Hoke, J.E., J.L. Hayes, and L.G. Renninger, 1981. Map Projections and Grid Systems for Meteorological Applications, AFGWTC/TN-79/003 (AD-A100324), Air Force Weather Agency, Offutt AFB, Nebraska. Hollinger, J., 1989: DMSP Special Sensor Microwave /Imager Calibration/ Validation Report, Volume I, Naval Research Laboratory, Washington D.C. Idso, S. 1981. A set of equations for full spectrum and 8 to 14ųm and 10.5 to 12.5ųm thermal radiation from cloudless skies. Water Resources Research, 17:295-304. Kiess, R.B. and W.M. Cox , 1988. The AFWGWC Automated Real-Time Cloud Analysis Model, Technical Report AFGWTC/TN-88/001 (AD-B121615), Air Force Weather Agency, Offutt AFB, Nebraska. Kopp, T.J. 1995. The Air Force Global Weather Central Temperature Model, Technical Report AFGWTC/TN-95/004, Air Force Weather Agency, Offutt AFB, Nebraska. Leemans, R. and W. Cramer. 1991. "The IIASA database for mean monthly values of temperature, precipitation and cloudiness on a global terrestrial grid". Research Report RR-91-18. November 1991. International Institute of Applied Systems Analyses, Laxenburg, pp. 61. Luces, S.A., J.D. Matens, and S. J. Hall. 1986. The AFGWC Snow Analysis Model, Technical Report AFGWTC/TN-86/001 (AD-A176202), Air Force Weather Agency, Offutt AFB, Nebraska. Mahrt, L. and M. Ek. 1984. The influence of atmospheric stability on potential evaporation, J. Climate and Appl. Meteor., 23:222-234. Richtie, J.T., U.Singh, D.C. Godwin, and W.T. Bowen. 1998. Cereal growth, development, and yield. G.Y. Tsuiji, et al, (eds), Understanding Options in for Agricultural Production, Luwer Academic Publishers, Great Britian, 79-98. Robine, K. 1998. Global Agrometeorological Database Exploitation Using Avenue Scripts and Sybase SQL Server. 18th Annual International ESRI User Conference, San Diego, CA, 26-30 July, 1998. Sinclair, T. R., S. Kitani, K. Hinson, J. Bruniard, and T. Horie. 1991. Soybean Flowering Date: Linear and Logistic Models Based on Temperature and Photoperiod. Crop Science, Vol 31, May-June, pp.786-790. Shapiro, R. 1987. A Simple Model for the Calculation of the Flux of Direct and Diffuse Solar Radiation Through the Atmosphere, AFGL-TR-87-0200, Air Force Geophysics Lab, Hanscom AFB, MA. Row III, W.R., and D. Hastings. 1997. TerrainBase Global Terrain Model, National Geophysical Data Center and World Data Center-A for Solid Earth Geophysics, Boulder, Colorado U.S.A. Tingley, W. 1988. Crop Condition Data Retrieval and Evaluation (CADRE) DBMS Dictionary. Lockheed Engineering and Sciences Company, Inc. Unpublished. Watchmann, R. 1975. Expansion of the atmospheric temperature moisture profiles in empirical orthogonal functions for remote sensing applications. Digest of preprints, Topical Mtg on Rem. Sens. of the Atm., Optical Society of America, Anaheim, CA. |
||||||||||||||||||||||||||||||||||||||||||||||||||||||||||||||||||||||||||||||||||||||||||||||||||||||||||||||||||||||||||||||||||||||||||||||||||||||||||||||||||||||||||||||||||||||||||||||||||||||||||||
| Top | ||||||||||||||||||||||||||||||||||||||||||||||||||||||||||||||||||||||||||||||||||||||||||||||||||||||||||||||||||||||||||||||||||||||||||||||||||||||||||||||||||||||||||||||||||||||||||||||||||||||||||||