IPAD
International
Production
Assessment
Division
Toggle navigation
Reports and Briefs
Commodity Intelligence Reports (CIR)
World Agricultural Production (WAP) Circulars
Geospatial Data
Crop Explorer
Commodity Explorer
Global Agricultural Monitoring (GLAM)
Global Reservoirs and Lakes Monitor (G-REALM)
Global Agricultural & Disaster Assesment System (GADAS)
Geotag Photo Gallery
Tropical Cyclone Monitor Maps
Flood Monitor Maps
Crop Calendars and Production Maps
Country Summary
Crop Calendars
Crop Production Maps
Monthly Crop Stage and Harvest Calendars
Monthly Production and Trade Maps
Other Global USDA Reports
World Agricultural Supply and Demand Estimates (WASDE)
USDA Weekly Weather and Crop Bulletin (NASS/WAOB)
PSD Online
FAS Attache GAIN Reports
PS&D Market and Trade Data
Help
About Us
FAS Home
/
IPAD Home
/
Crop Explorer
/
Northern South America
Crop Explorer
Toolbox
Home
Data Sources
Most Recent Data
Precipitation
Moving Precipitation and Cumulative Precipitation (Pentad)
Consecutive Dry Days
Temperature
Average Temperature
Maximum Temperature
Minimum Temperature
Heat Damage and Stress
Soil Moisture
Soil Moisture (CPC Leaky Bucket)
Percent Soil Moisture
Surface Soil Moisture
Subsurface Soil Moisture
Vegetation Index
NDVI (MODIS-Terra)
Growing Season
2025 Rainy Season (May - Oct)
2024 Dry Season (Nov - Apr)
2024 Rainy Season (May - Oct)
2023 Dry Season (Nov - Apr)
2023 Rainy Season (May - Oct)
2022 Dry Season (Nov - Apr)
Additional Resources
Area, Yield and Production
WAP Production Briefs
Commodity Intelligence Reports
Bolivia
Colombia
Ecuador
French Guiana
Guyana
Peru
Suriname
Trinidad and Tobago
Venezuela
Country Summary
Geotag Photo Gallery
Crop Production Maps
Crop Calendar
Country
Bolivia
Colombia
Ecuador
French Guiana
Guyana
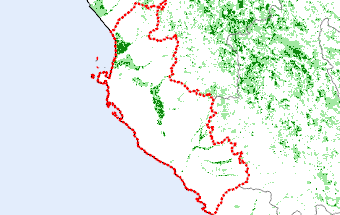
Peru
Suriname
Trinidad and Tobago
Venezuela
Peru 2018 Rainy Season (May - Oct) — (Last Chart Updated on )
Subregions:
Select a Subregion
Ica
Ancash
San Martín
Lima
La Libertad
Loreto
Lambayeque
Cajamarca
Piura
Order by:
Subregion Name
|
Wheat
|
Rice
|
Barley
|
Corn
|
Sorghum
|
Soybean
|
Cotton
|
Palm Oil
|
Ica (14% of total corn production)
View Satellite Image
Ancash (13% of total corn production)
View Satellite Image
San Martín (13% of total corn production)
View Satellite Image
Lima (12% of total corn production)
View Satellite Image
La Libertad (9% of total corn production)
View Satellite Image
Loreto (9% of total corn production)
View Satellite Image
Lambayeque (6% of total corn production)
View Satellite Image
Cajamarca (5% of total corn production)
View Satellite Image
Piura (5% of total corn production)
View Satellite Image
Top
Stay Connected
FAS on Twitter
Get Email Updates
FAS Home
USDA.gov
Economic Research Service
World Agricultural Outlook Board
Plain Writing
Trade Links
FOIA
Accessibility Statement
Privacy Policy
Non Discrimination Statement
Information Quality
USA.gov
White House