
Barley Explorer
| |||||||
 | Rank | Country | Percent of World Production (Percent) | Production (1000 MT) | Crop Production Map | Cropland NDVI (MODIS) | Cumulative Precipitation (mm) |
 | 1 | European Union | 33 | 47,903 | 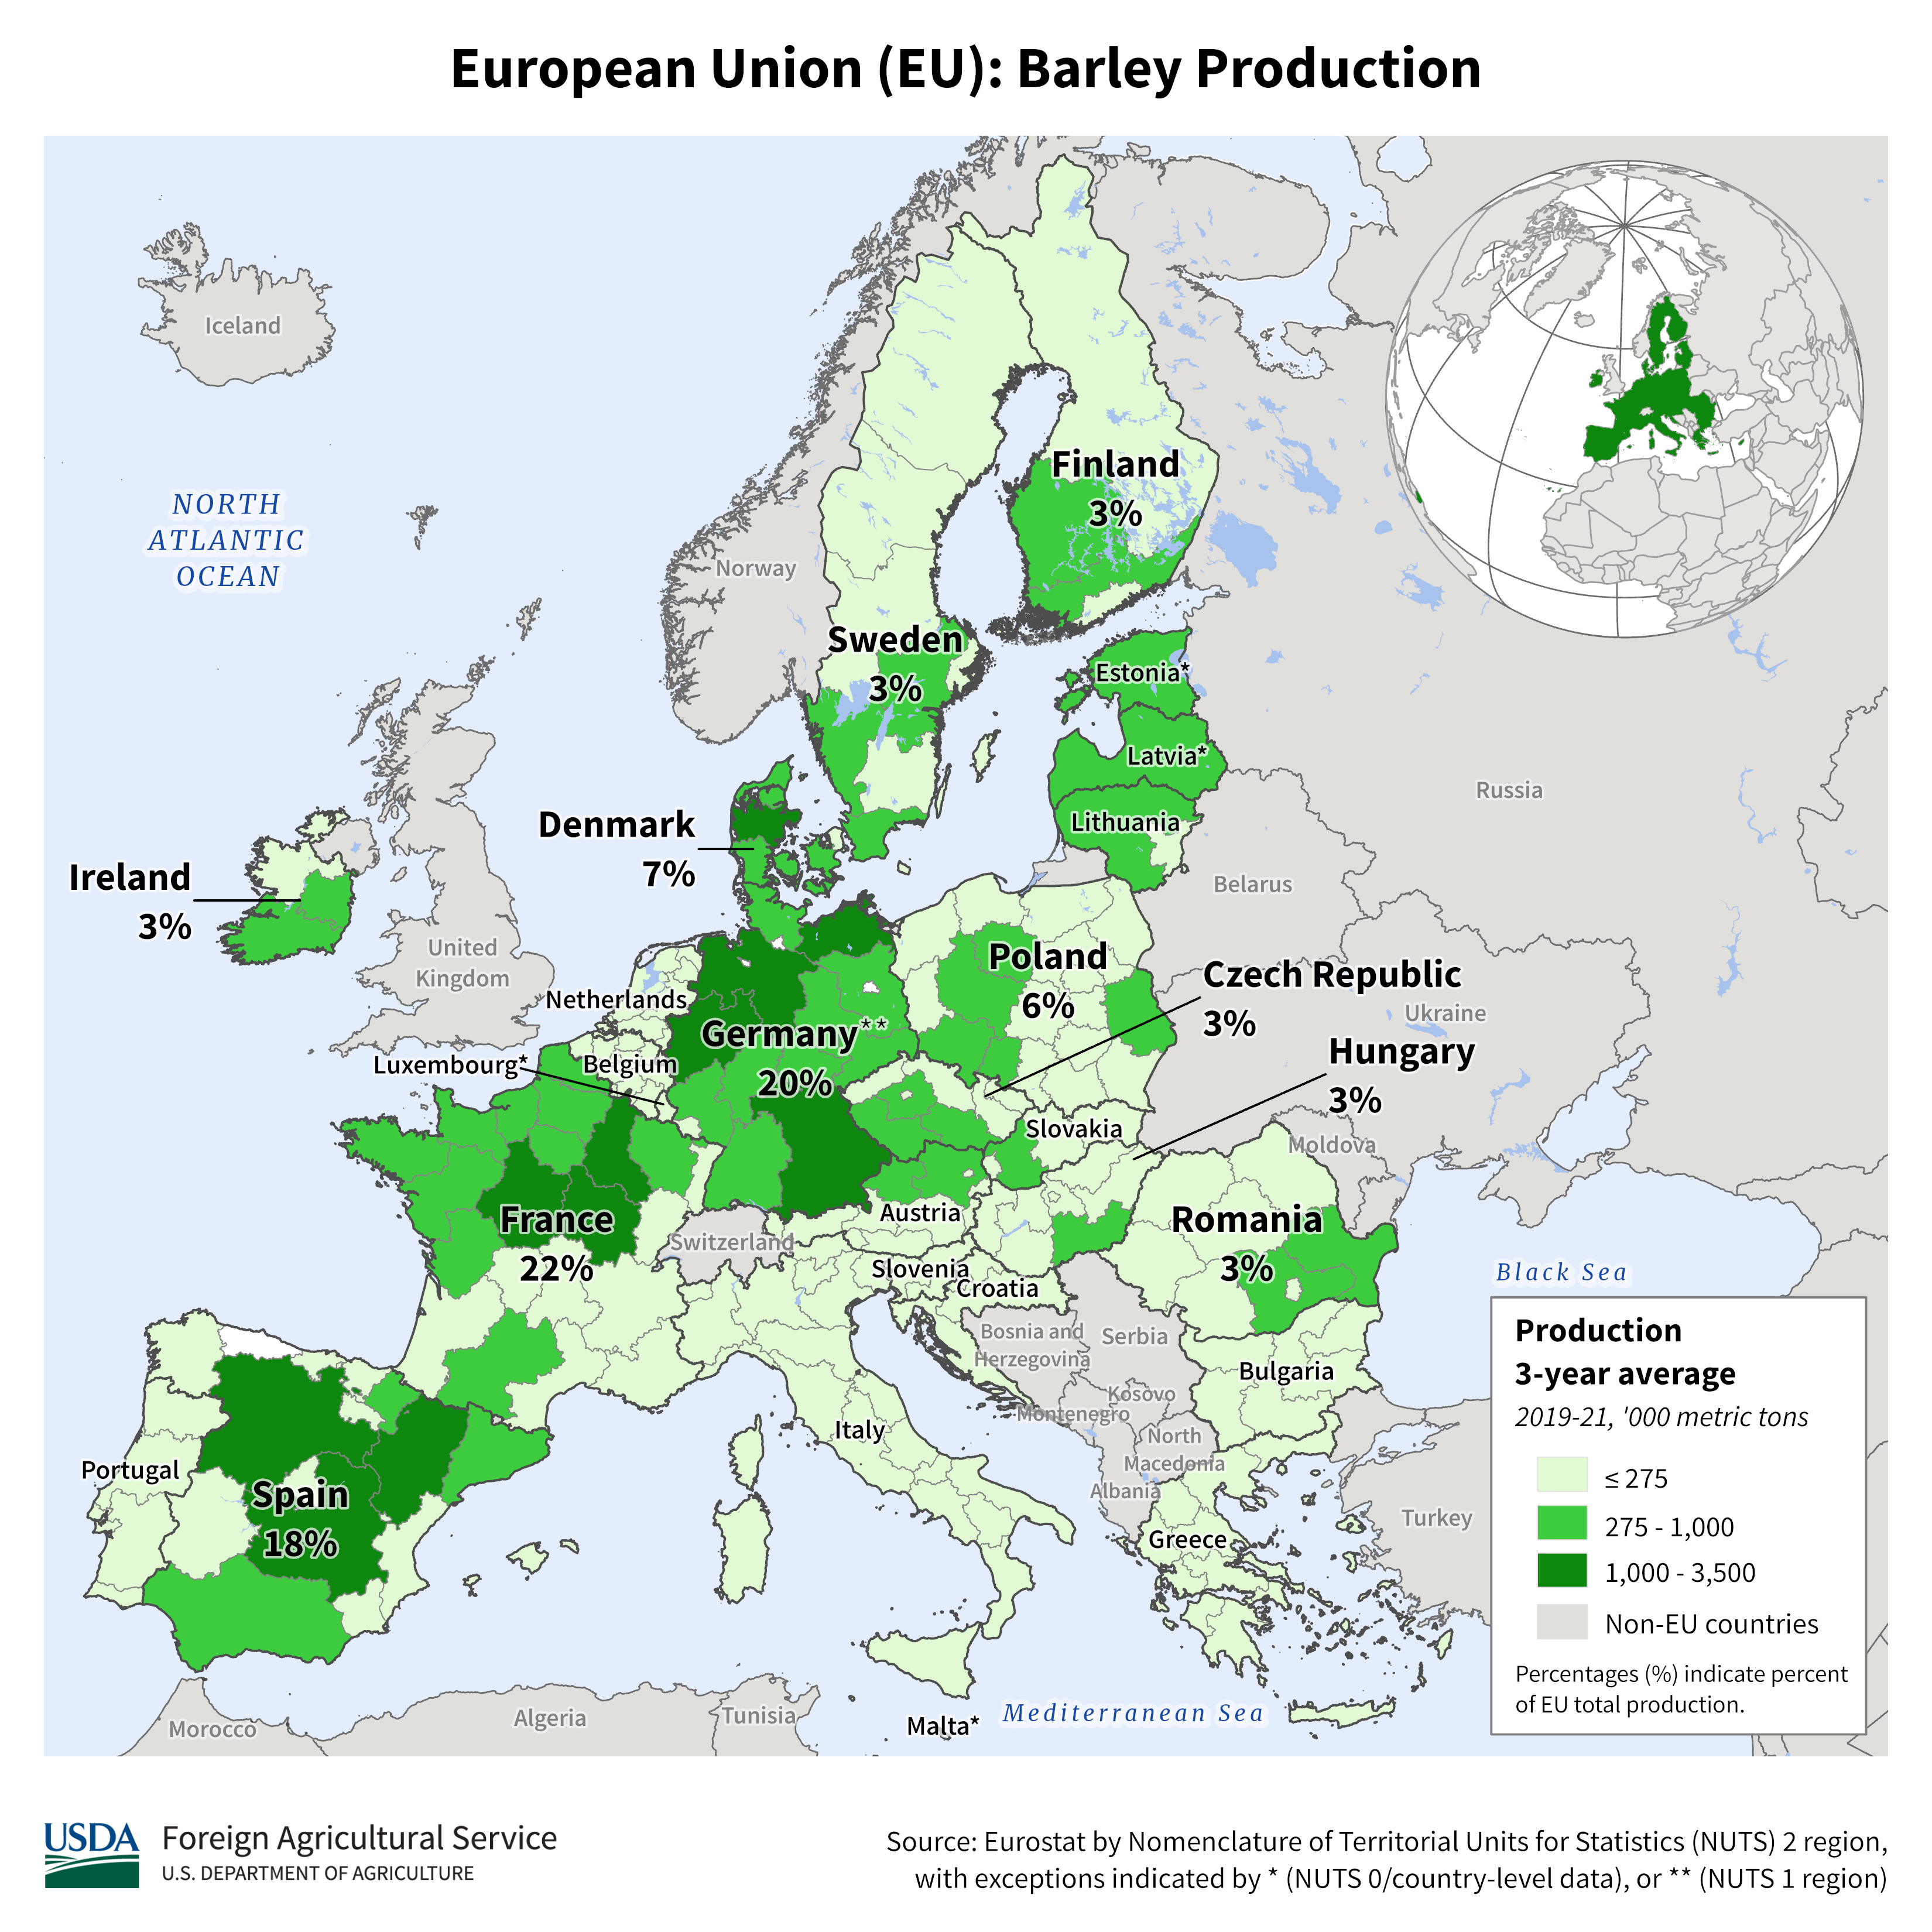 |  |  |
| 2 | Russia | 14 | 20,500 | 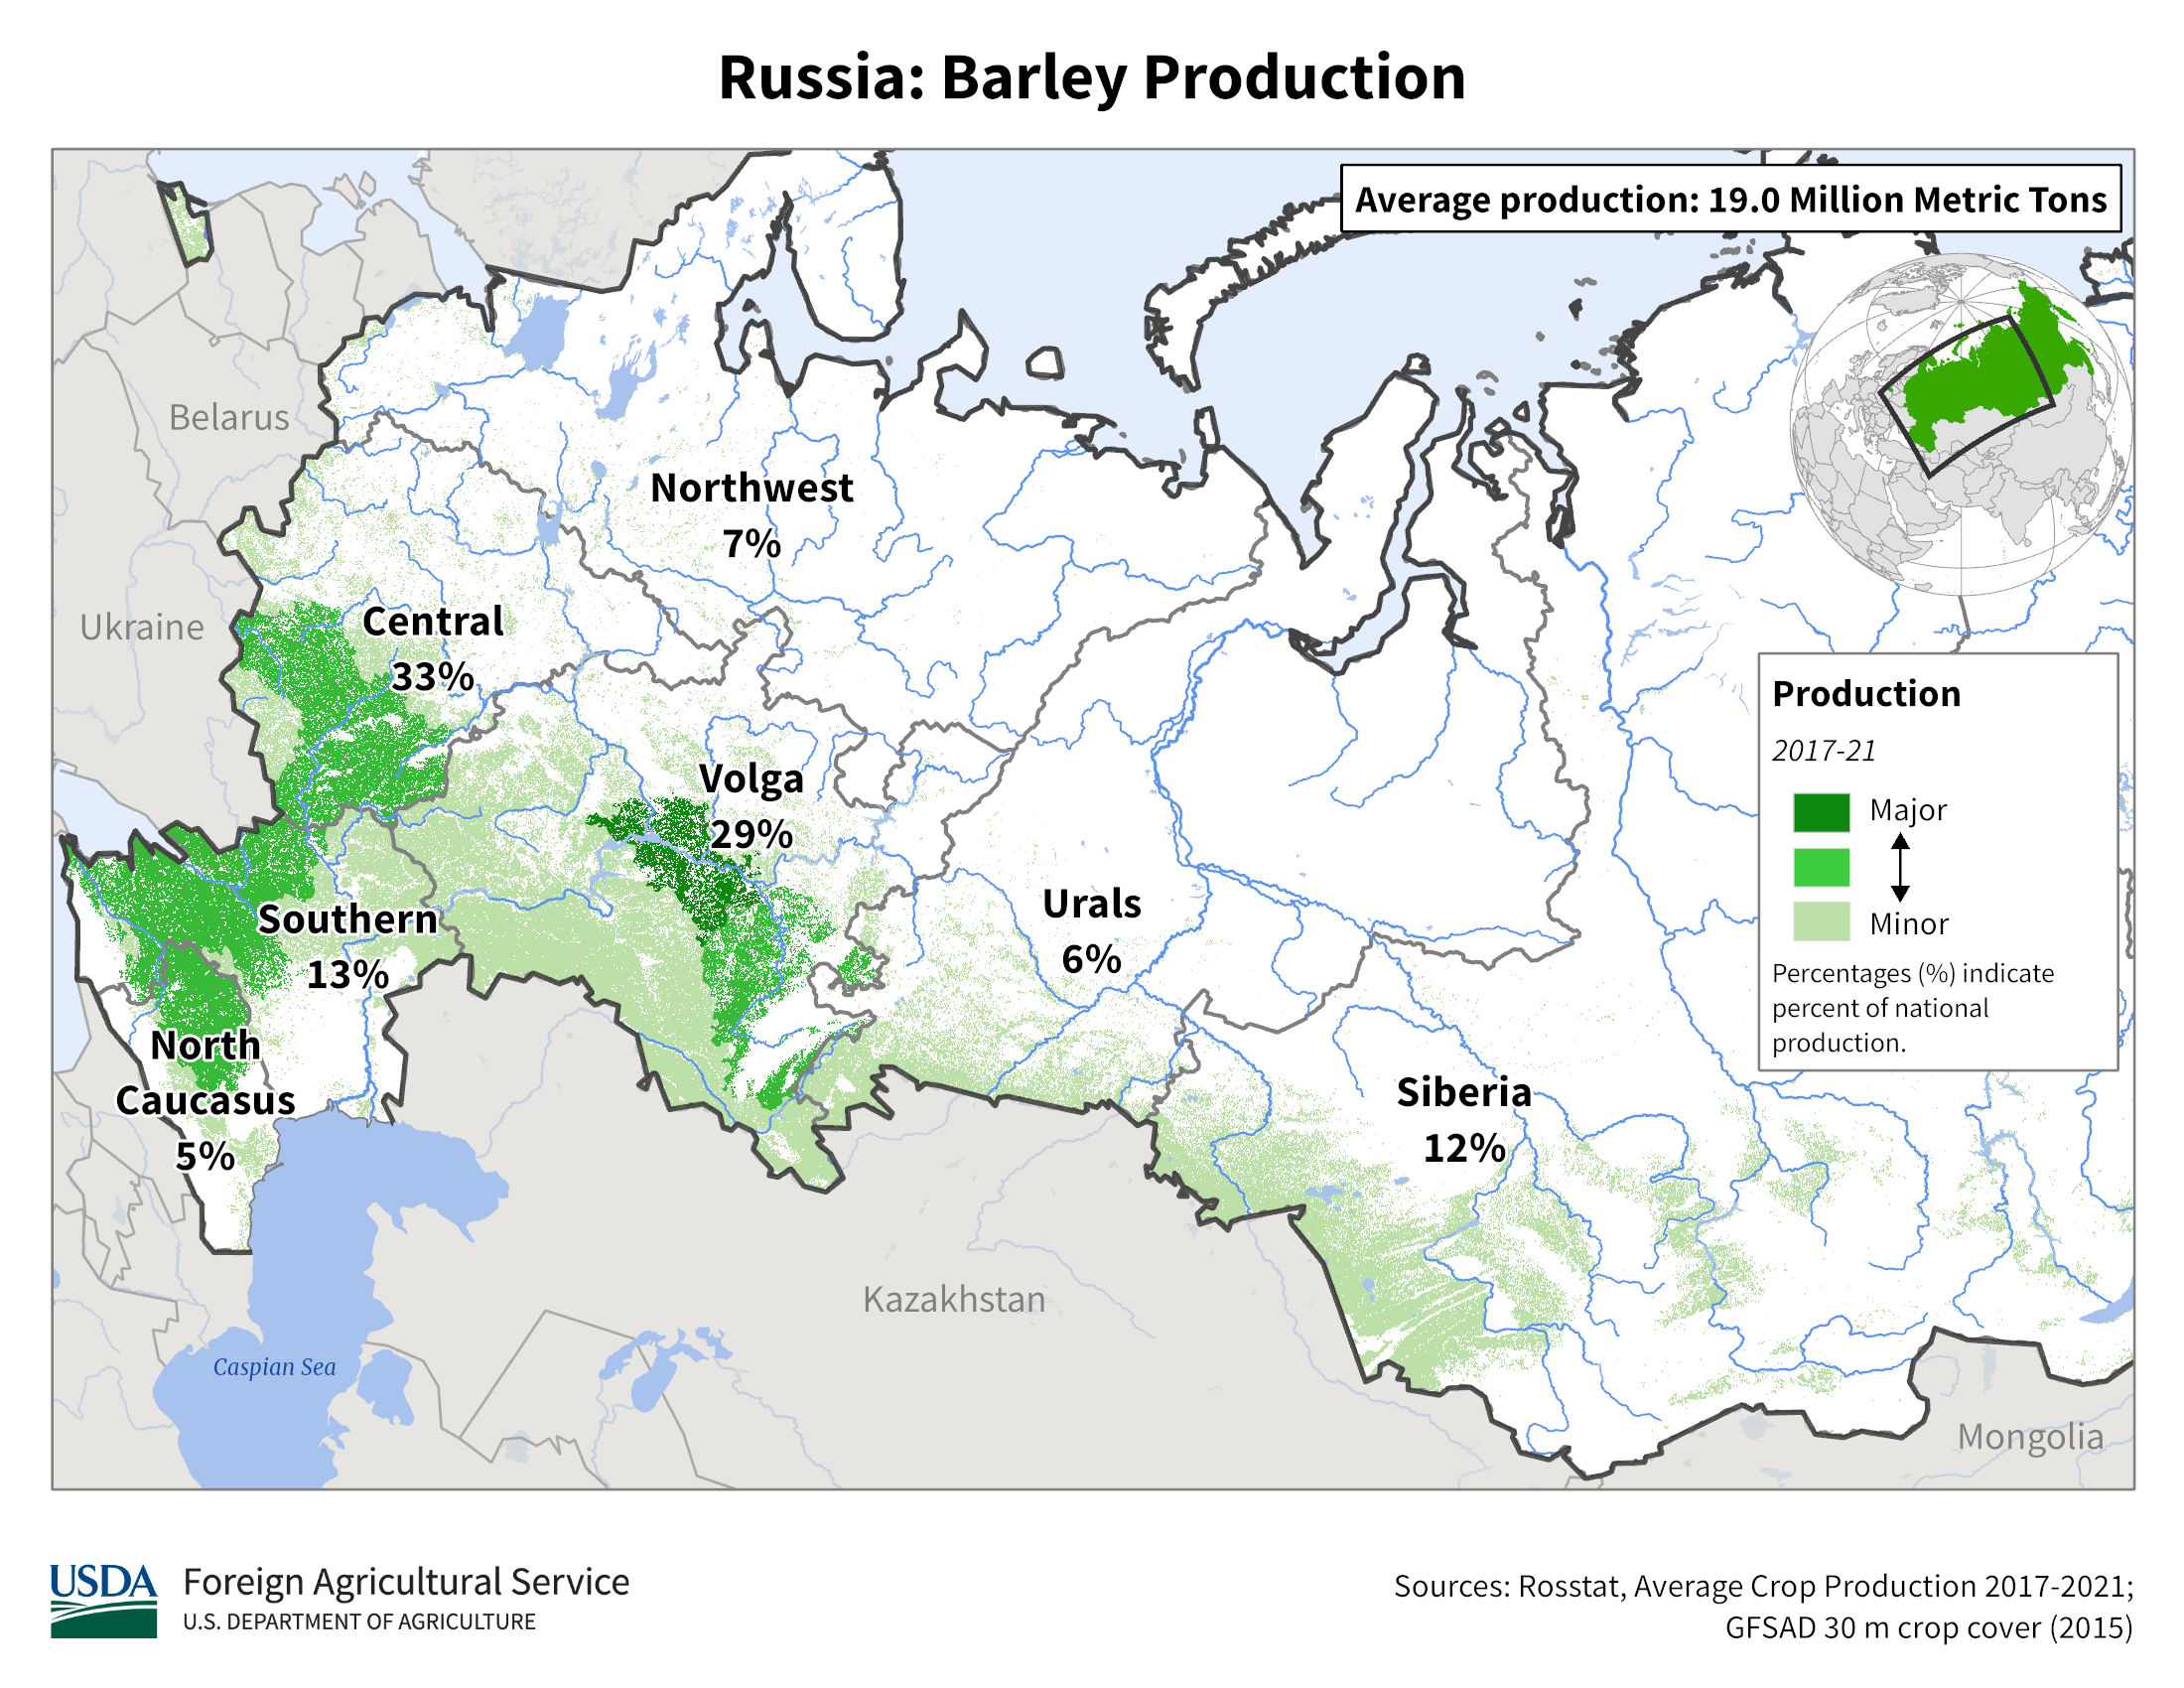 | 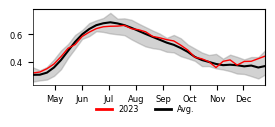 | 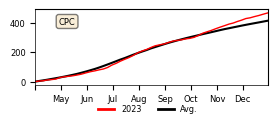 |
| 3 | Australia | 8 | 10,800 | 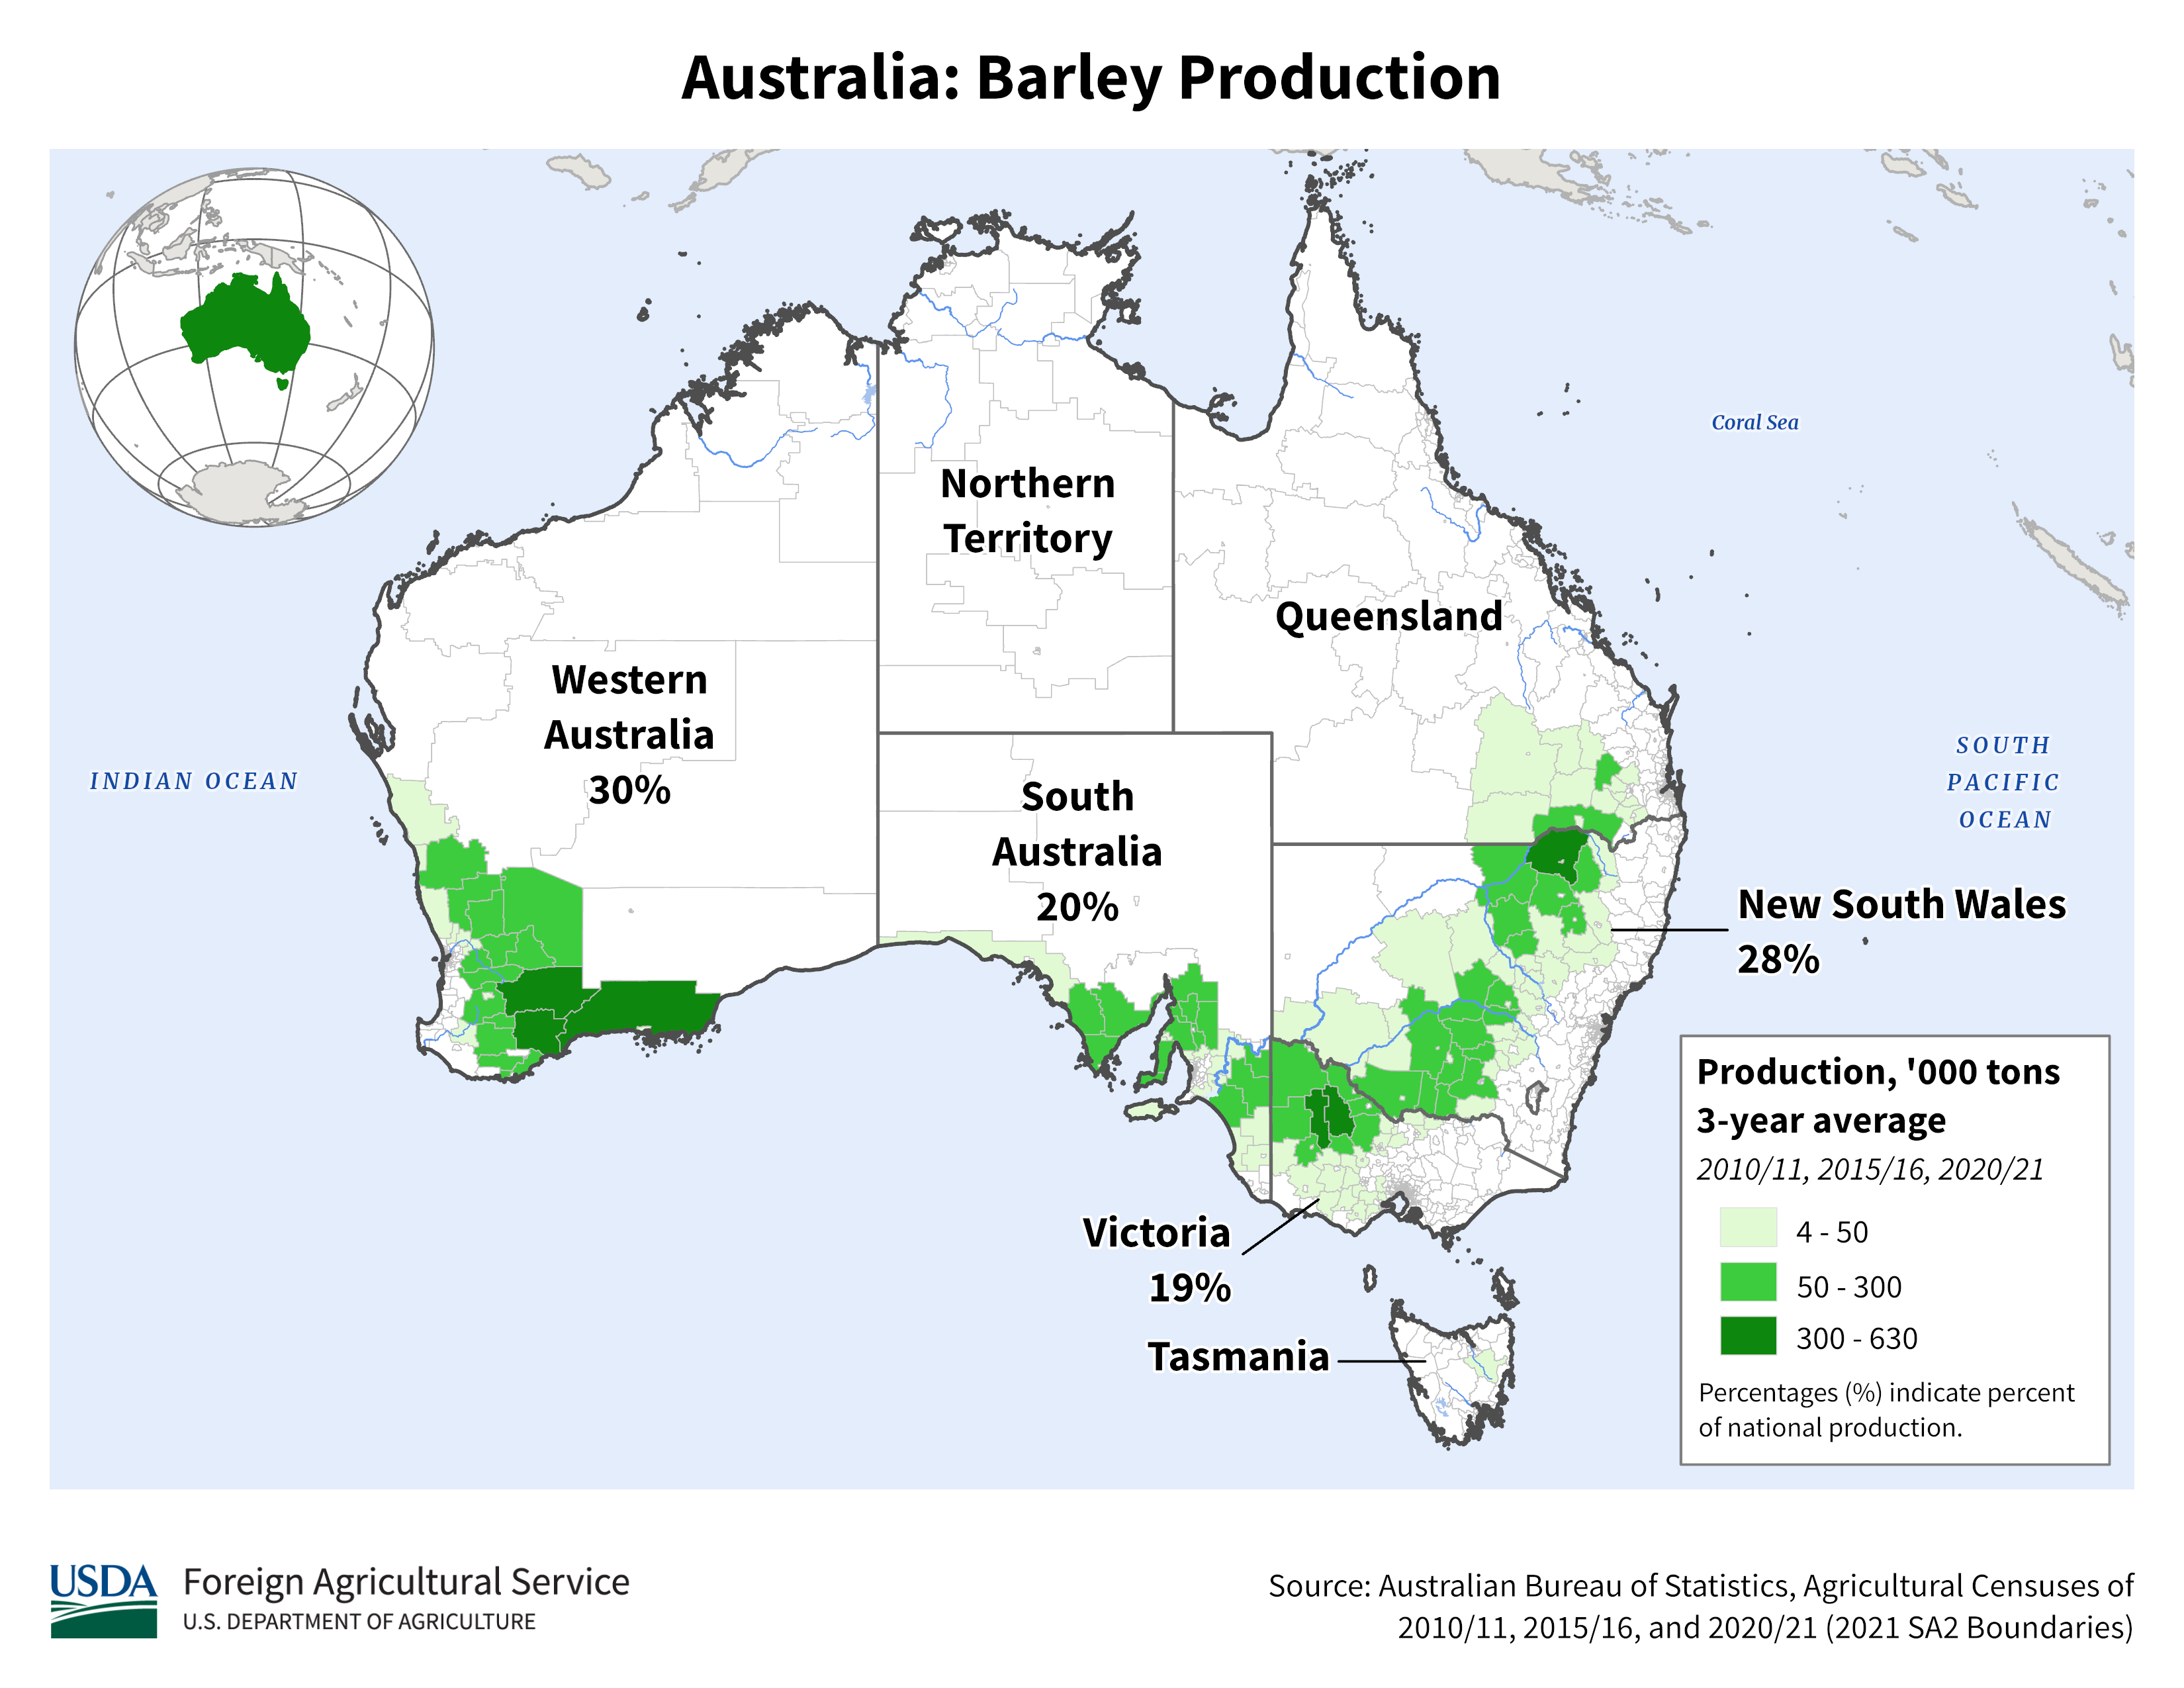 | 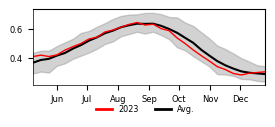 | 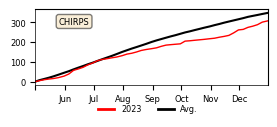 |
| 4 | Canada | 6 | 8,905 | 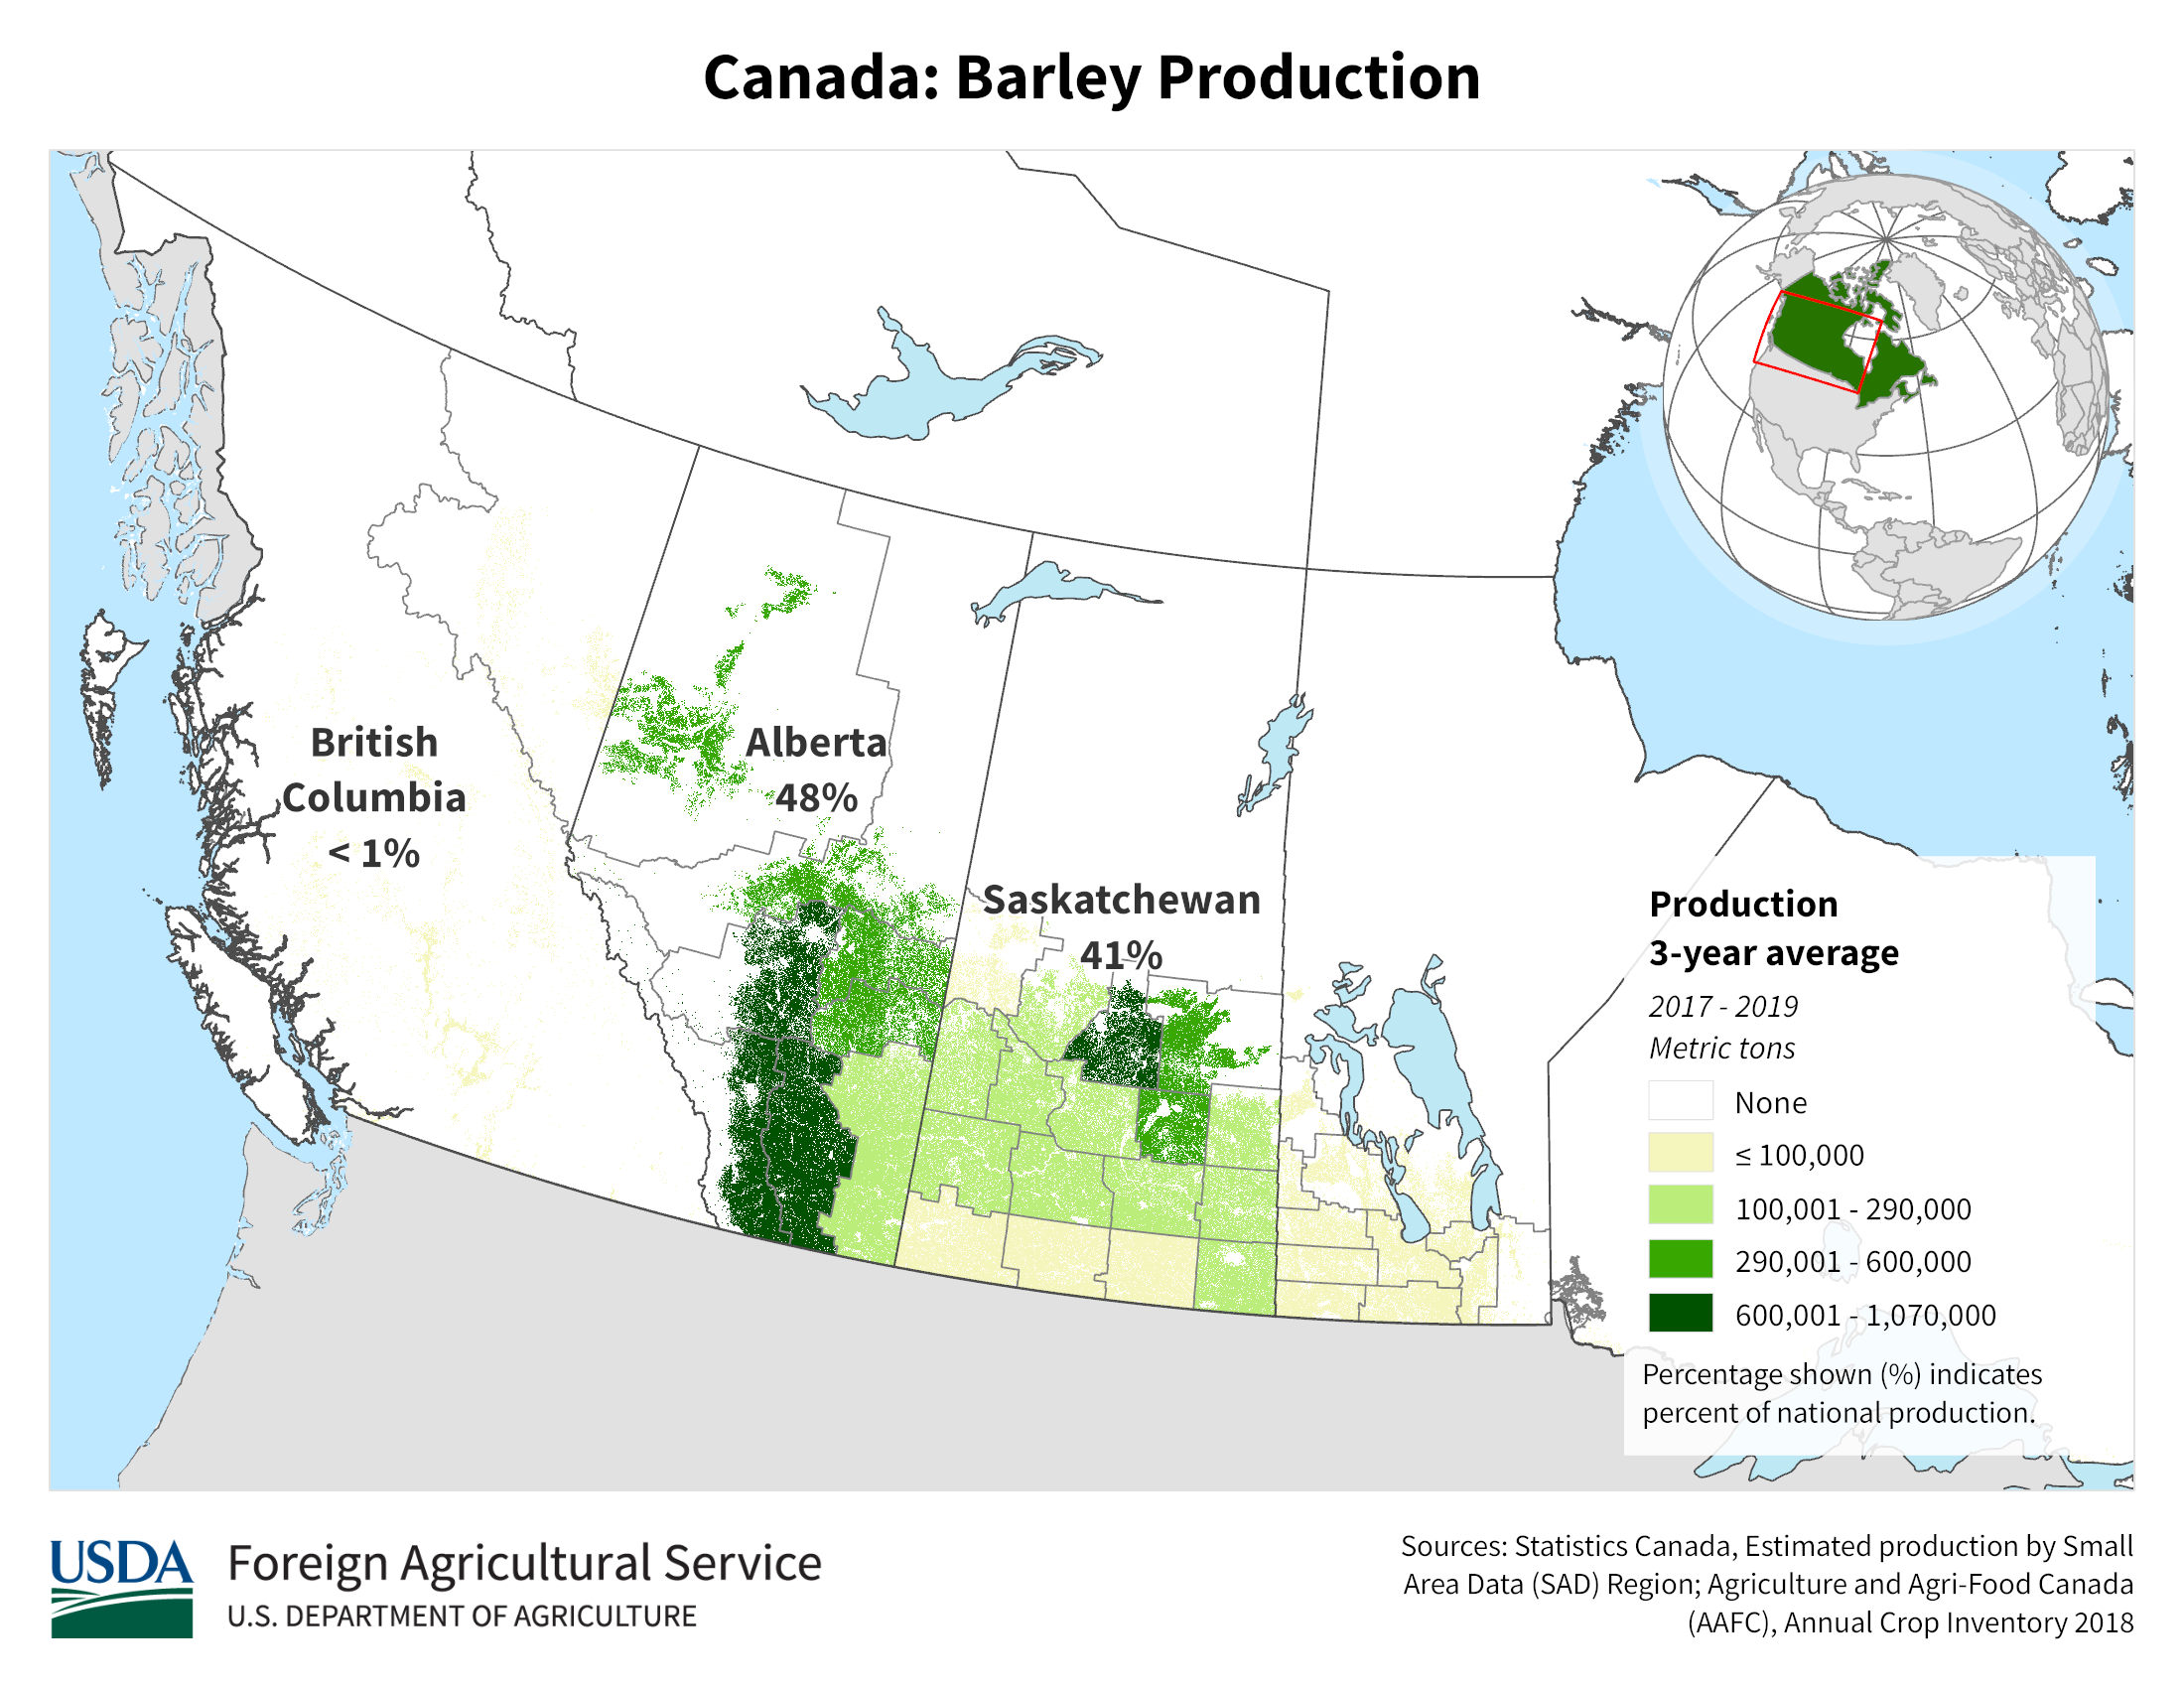 | 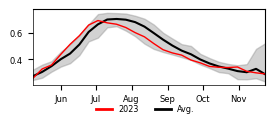 | 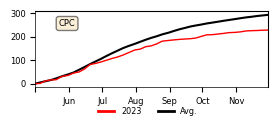 |
| 5 | Turkey | 6 | 8,000 | 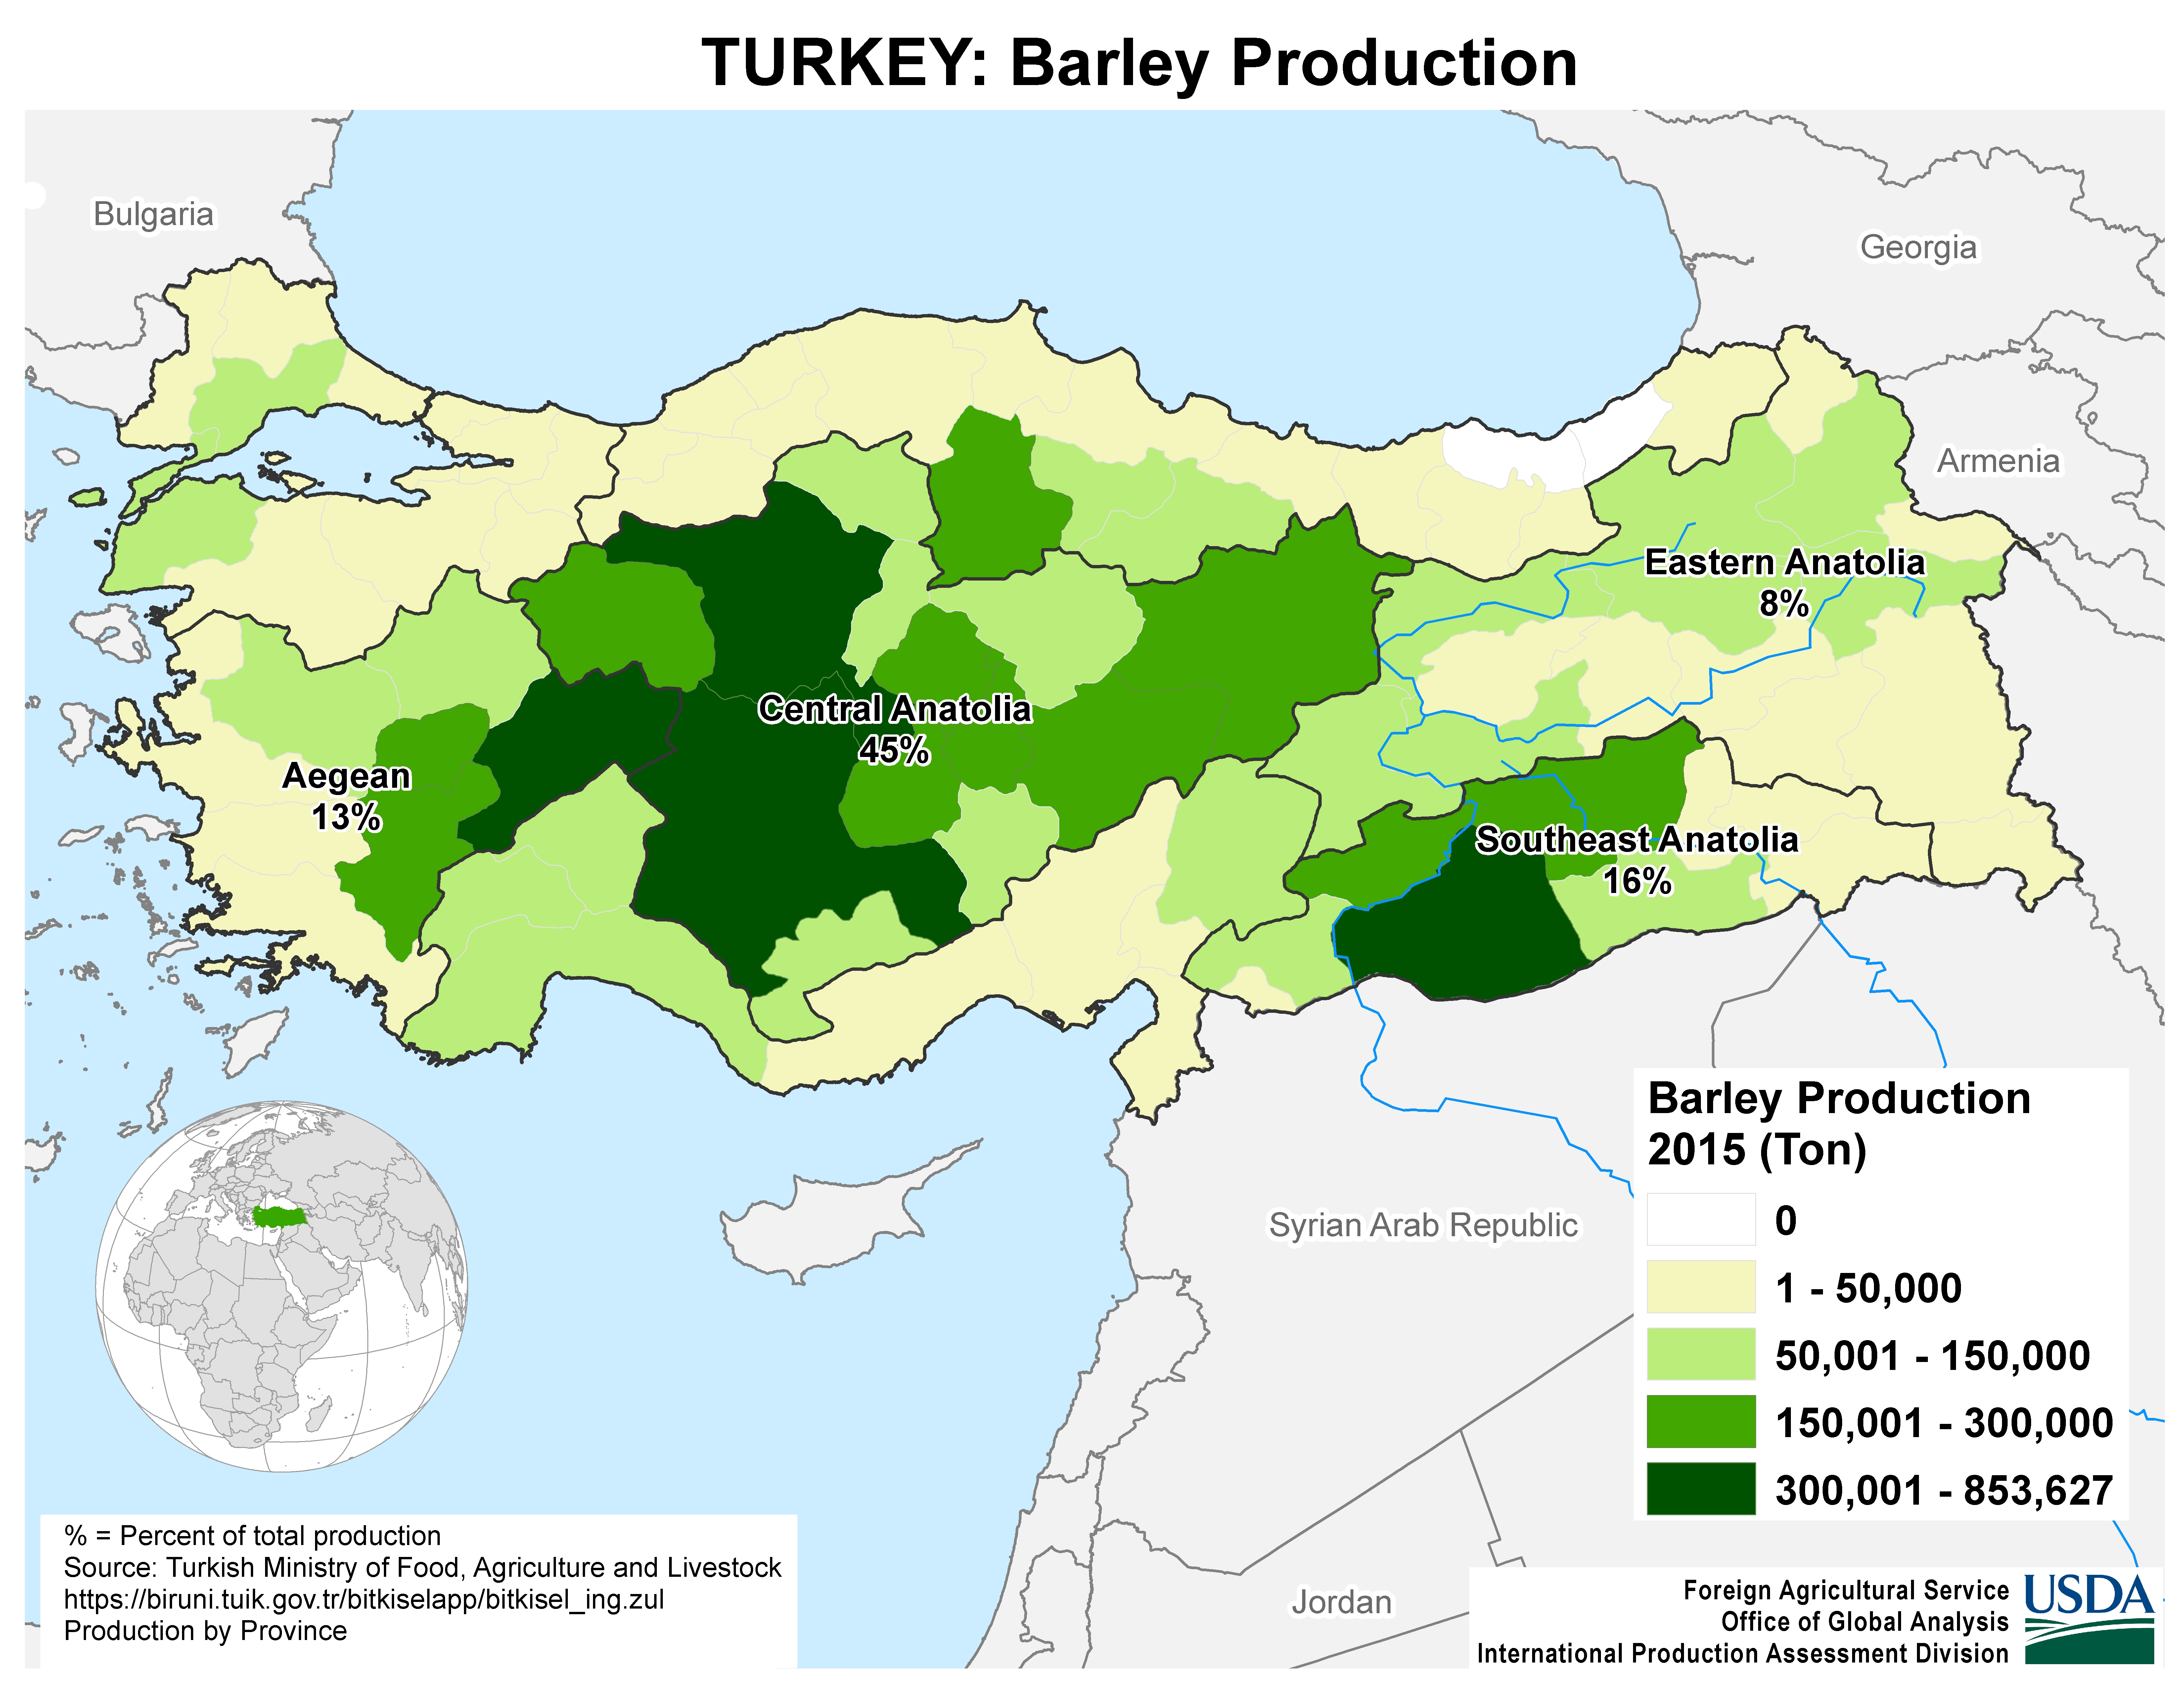 |  |  |
| 6 | United Kingdom | 5 | 6,963 | 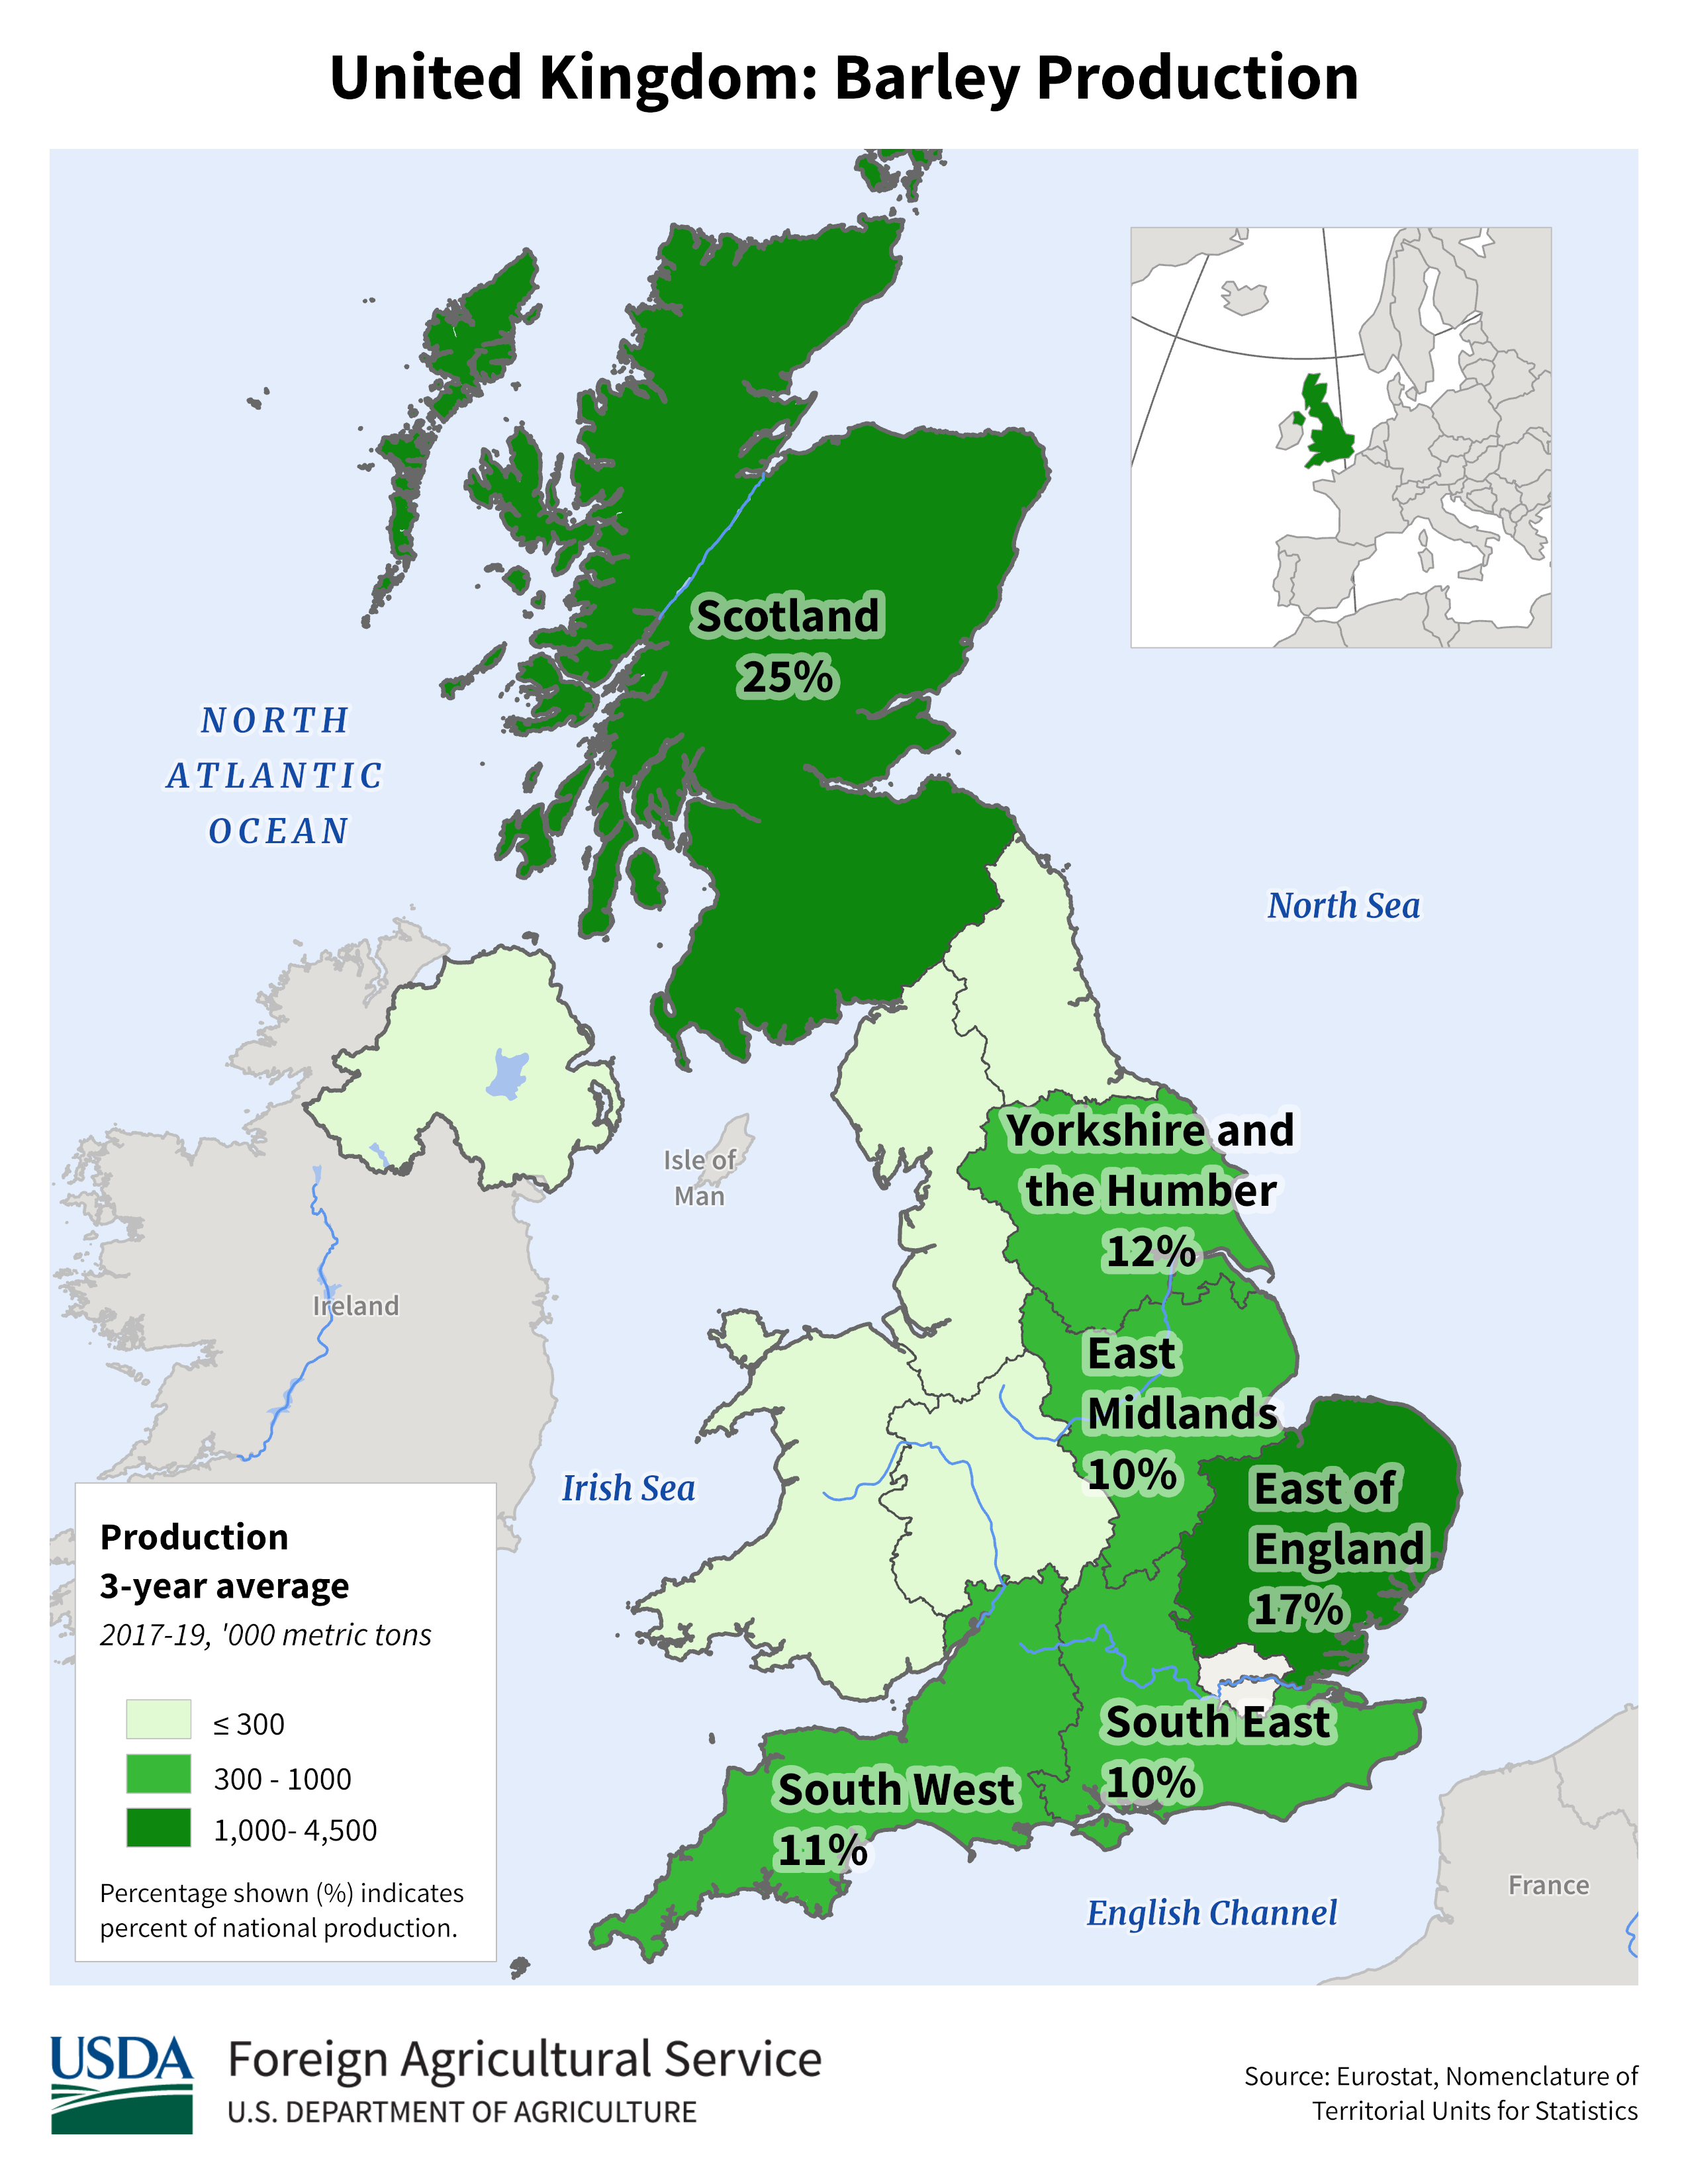 | 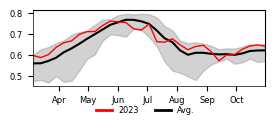 | 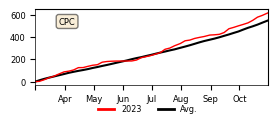 |
| 7 | Ukraine | 4 | 6,350 | 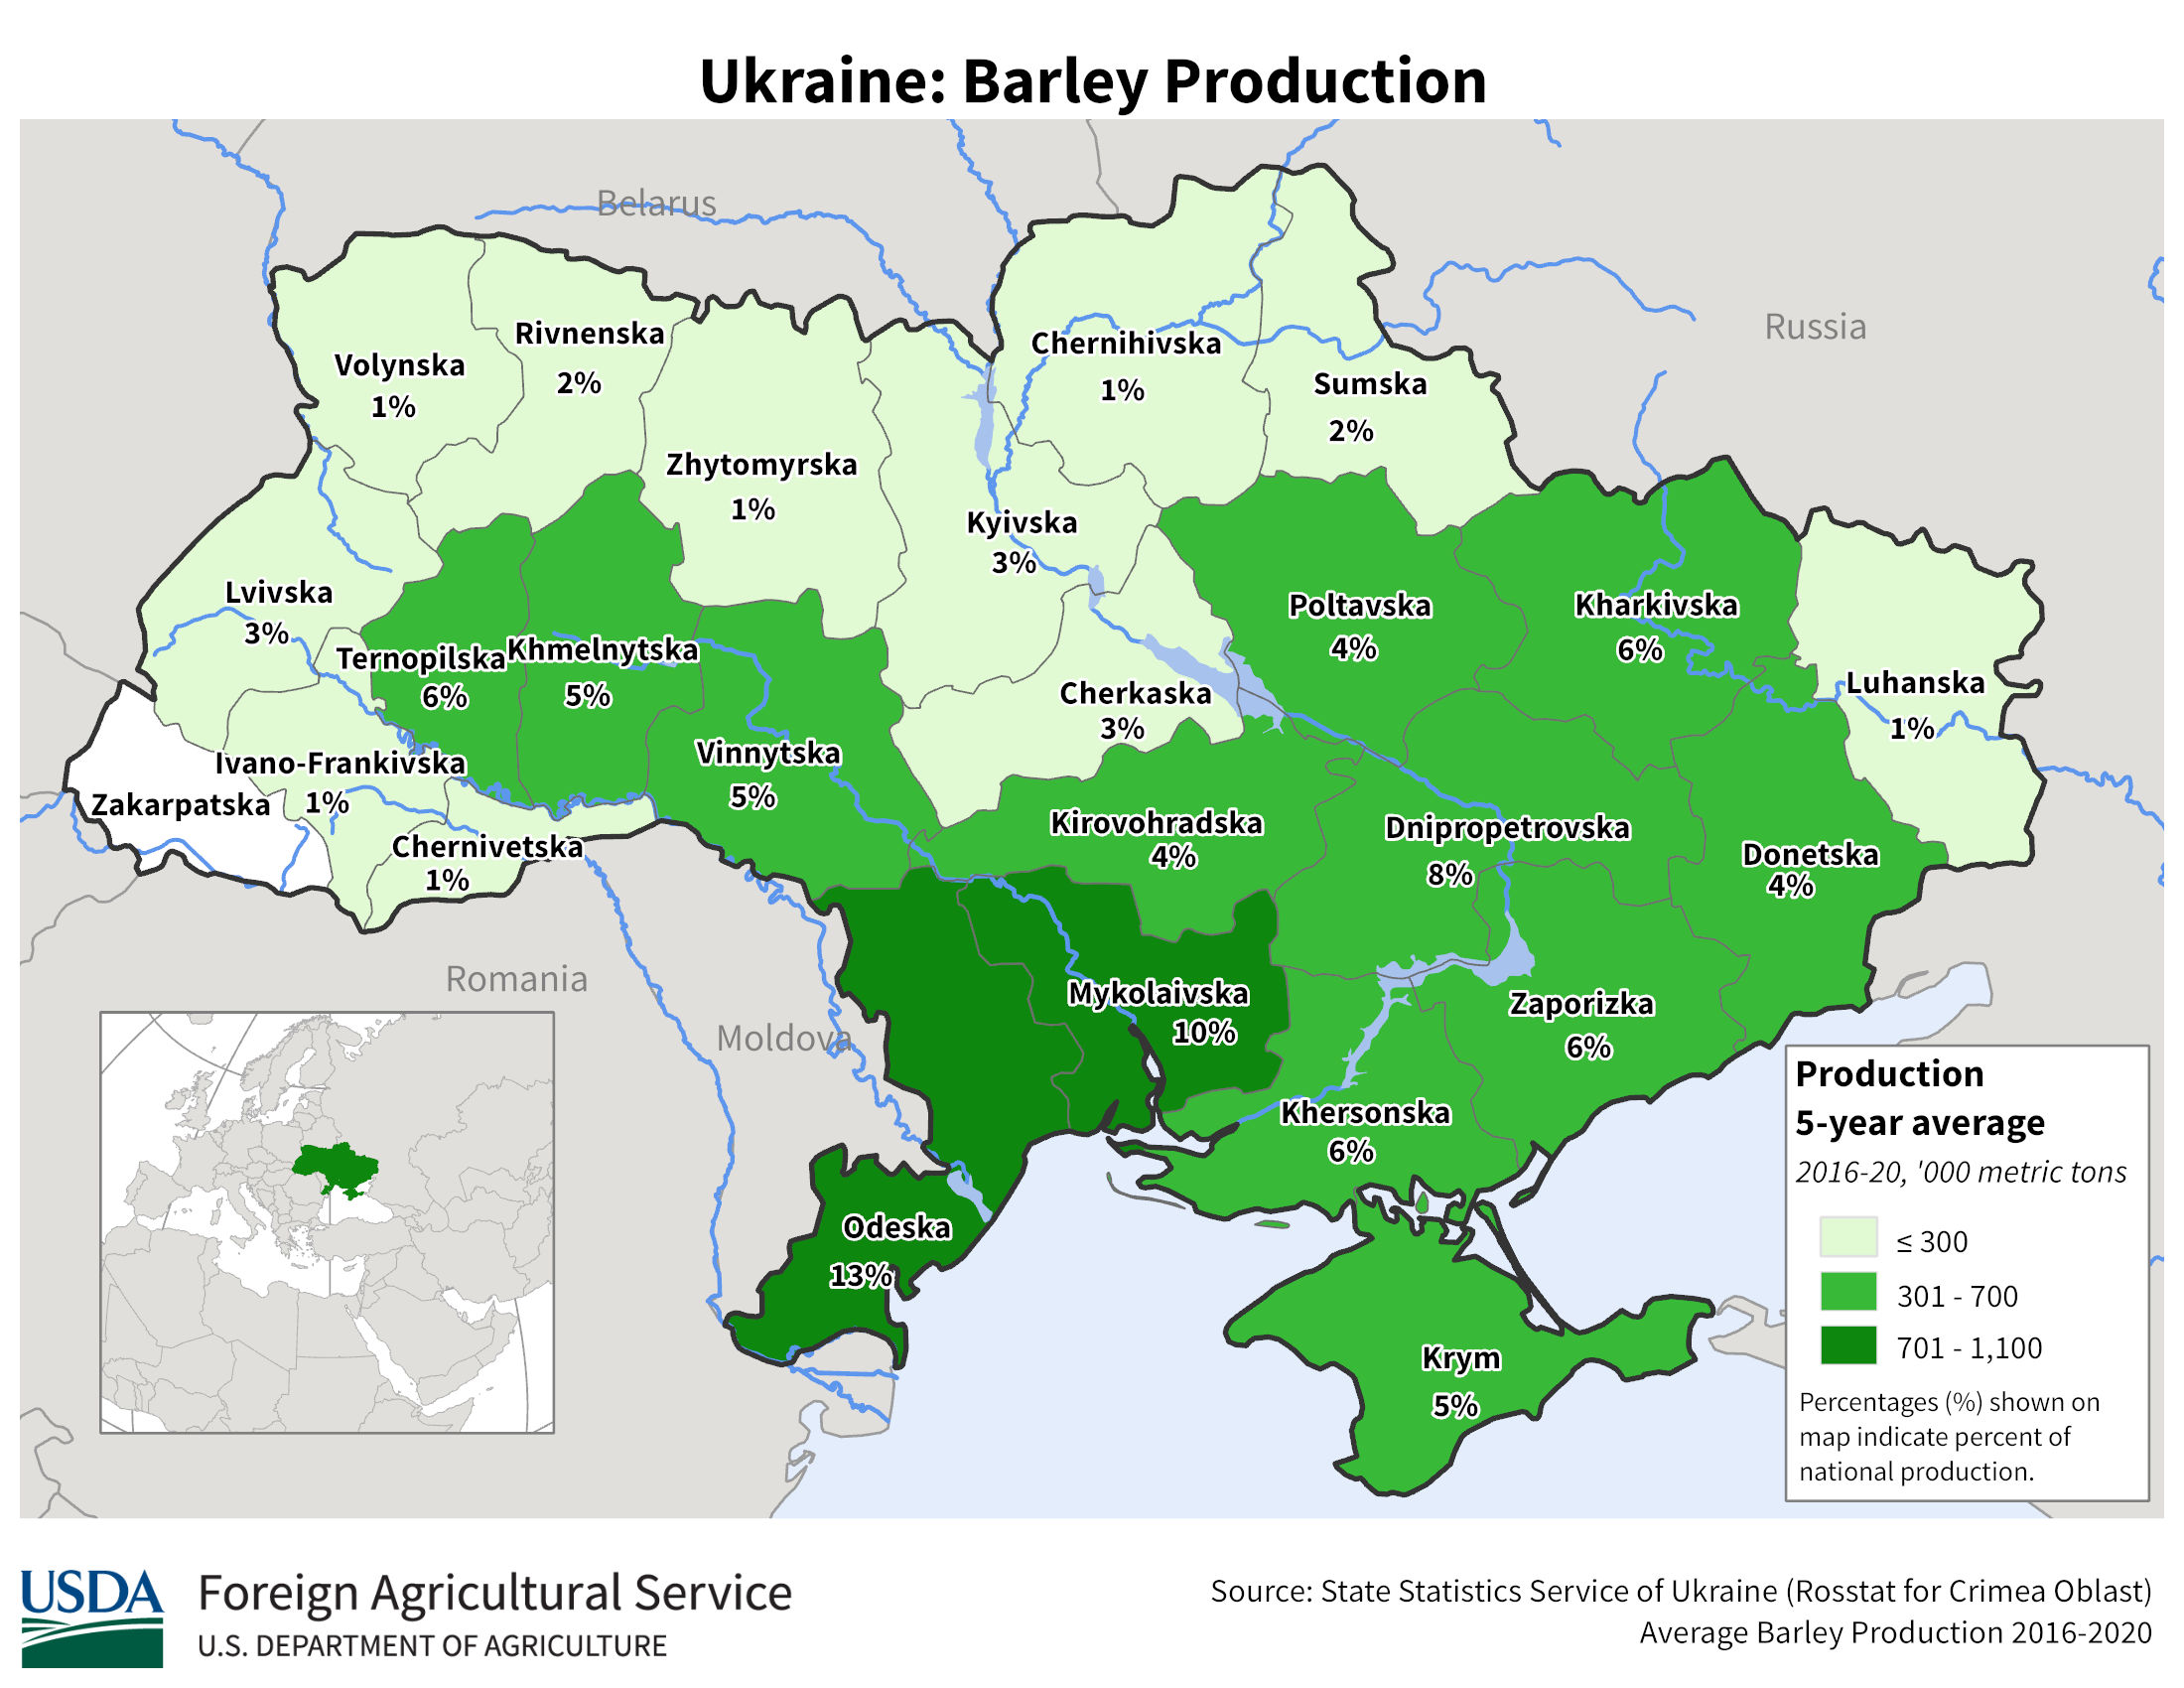 | 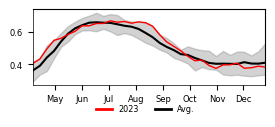 | 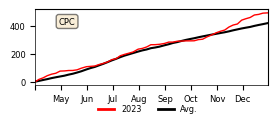 |
| 8 | Argentina | 4 | 5,100 | 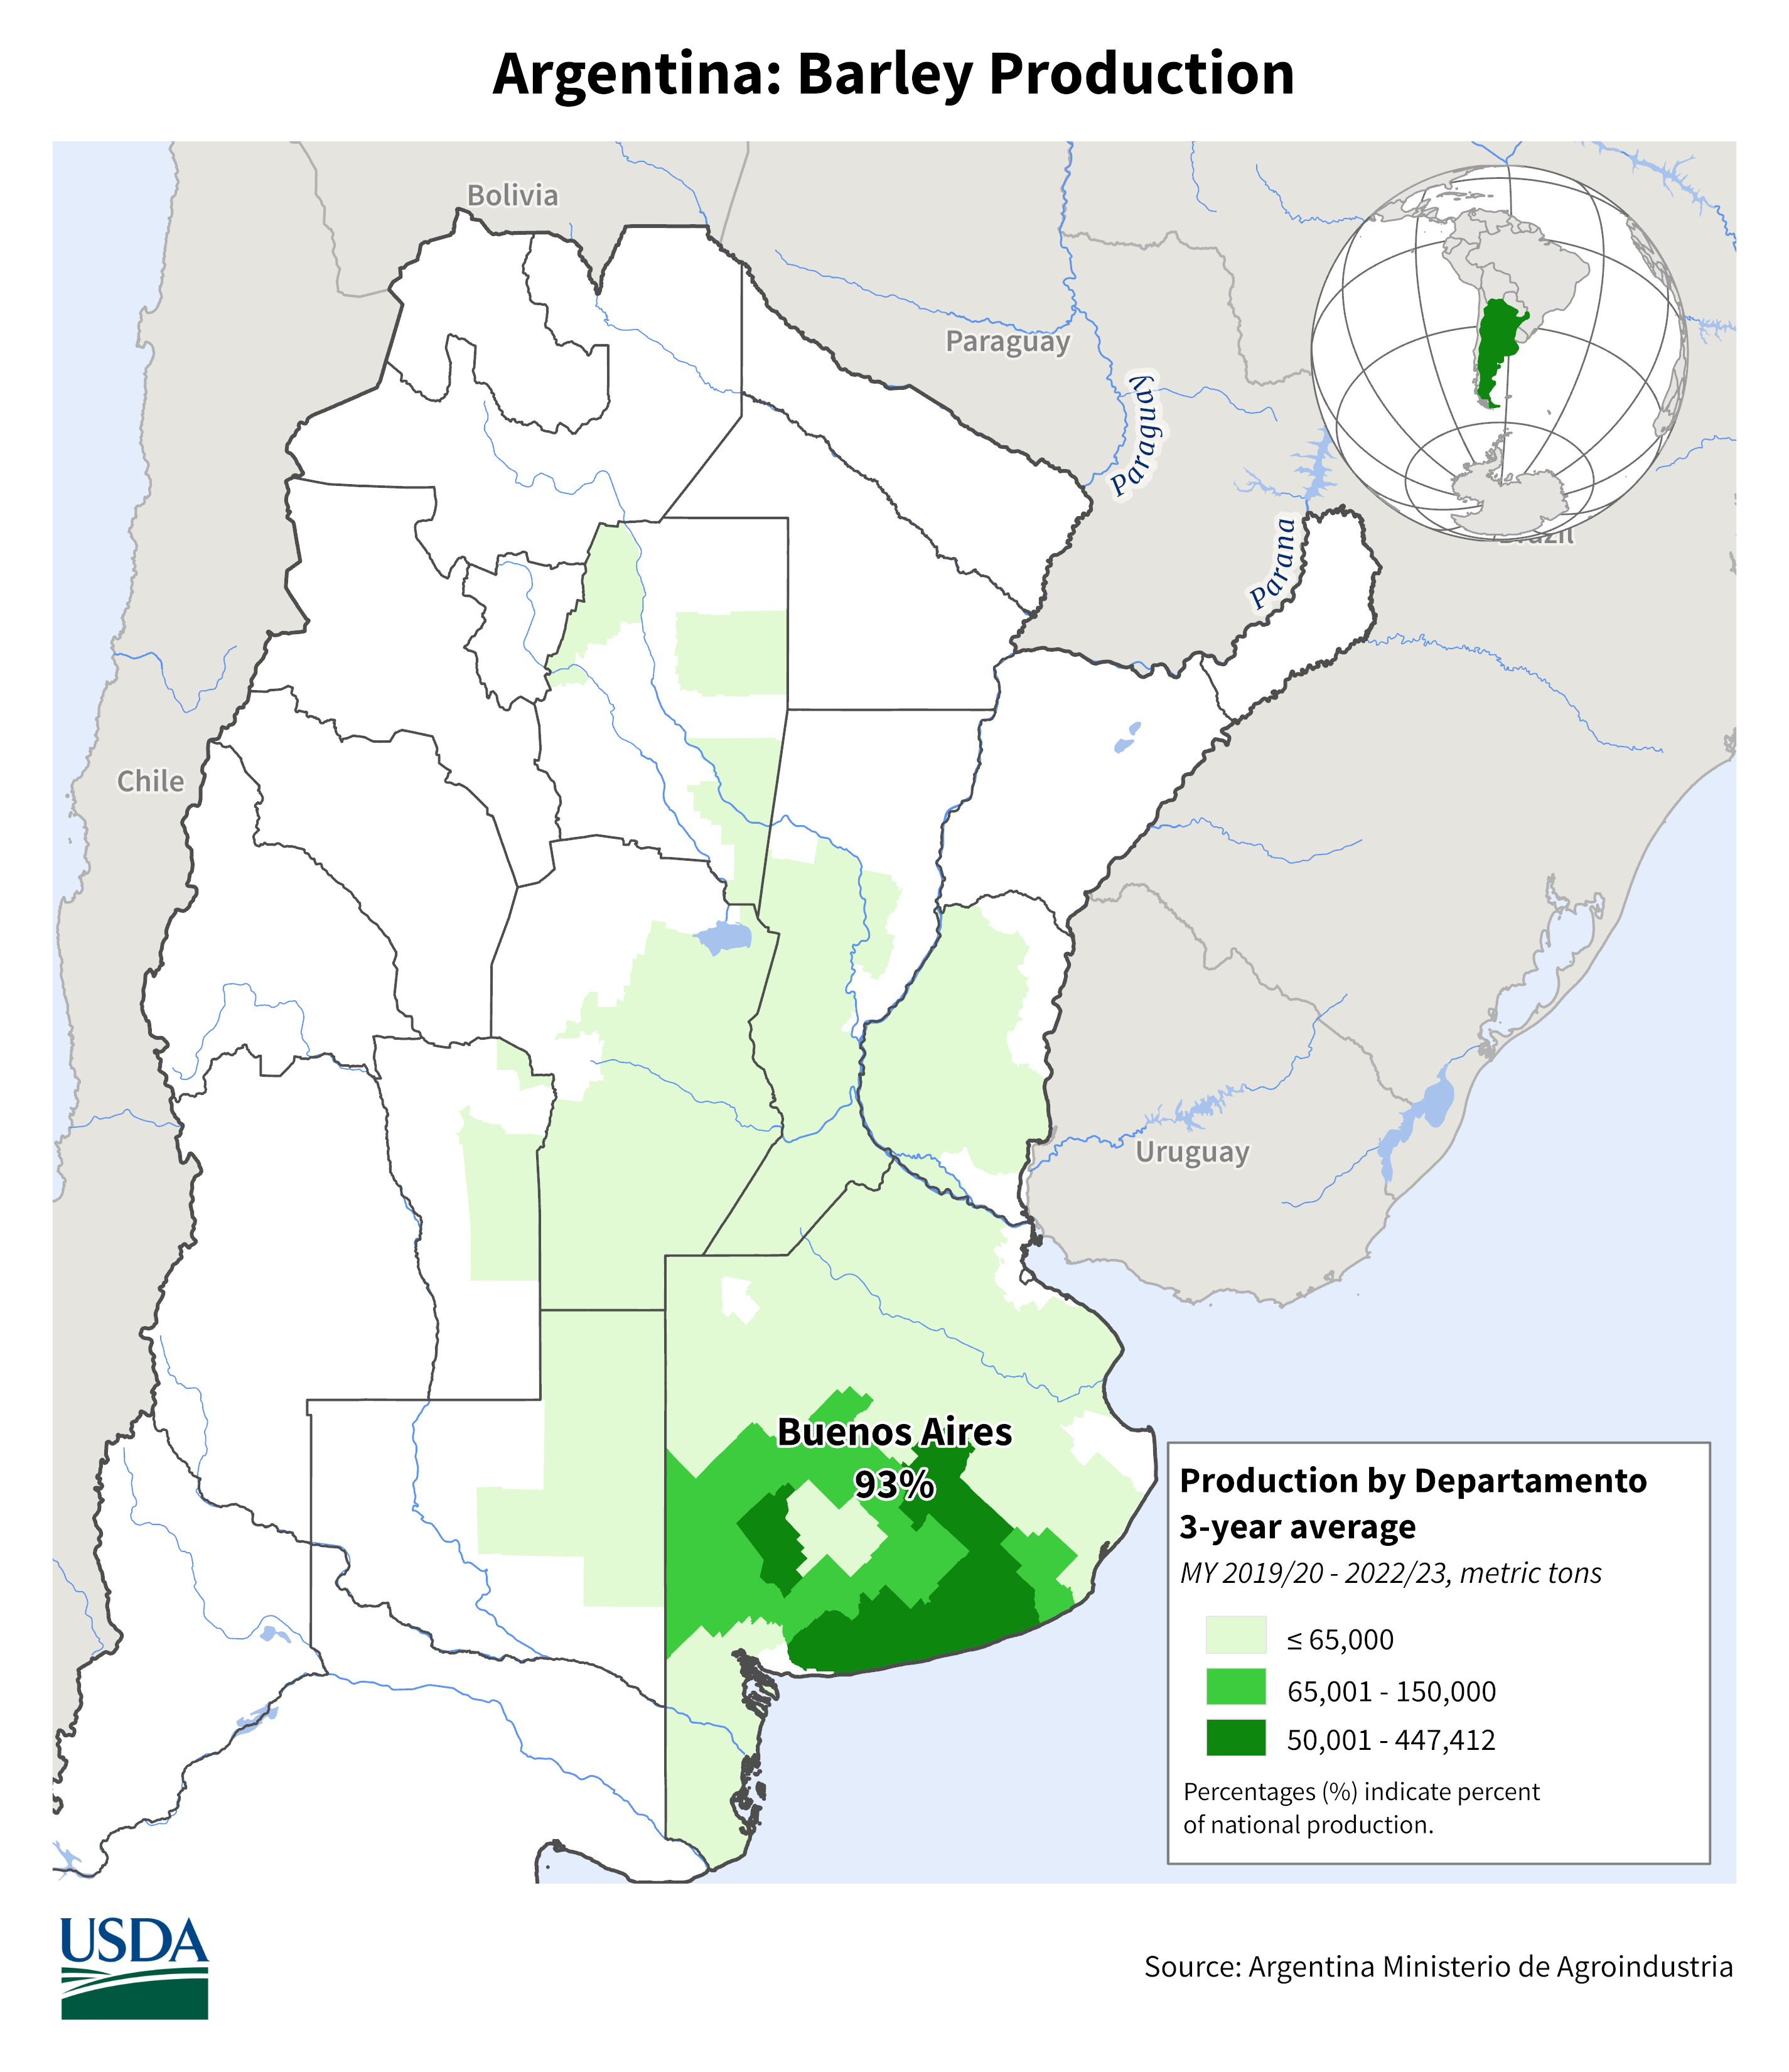 | 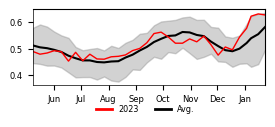 | 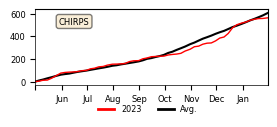 |
| 9 | United States | 3 | 4,052 | 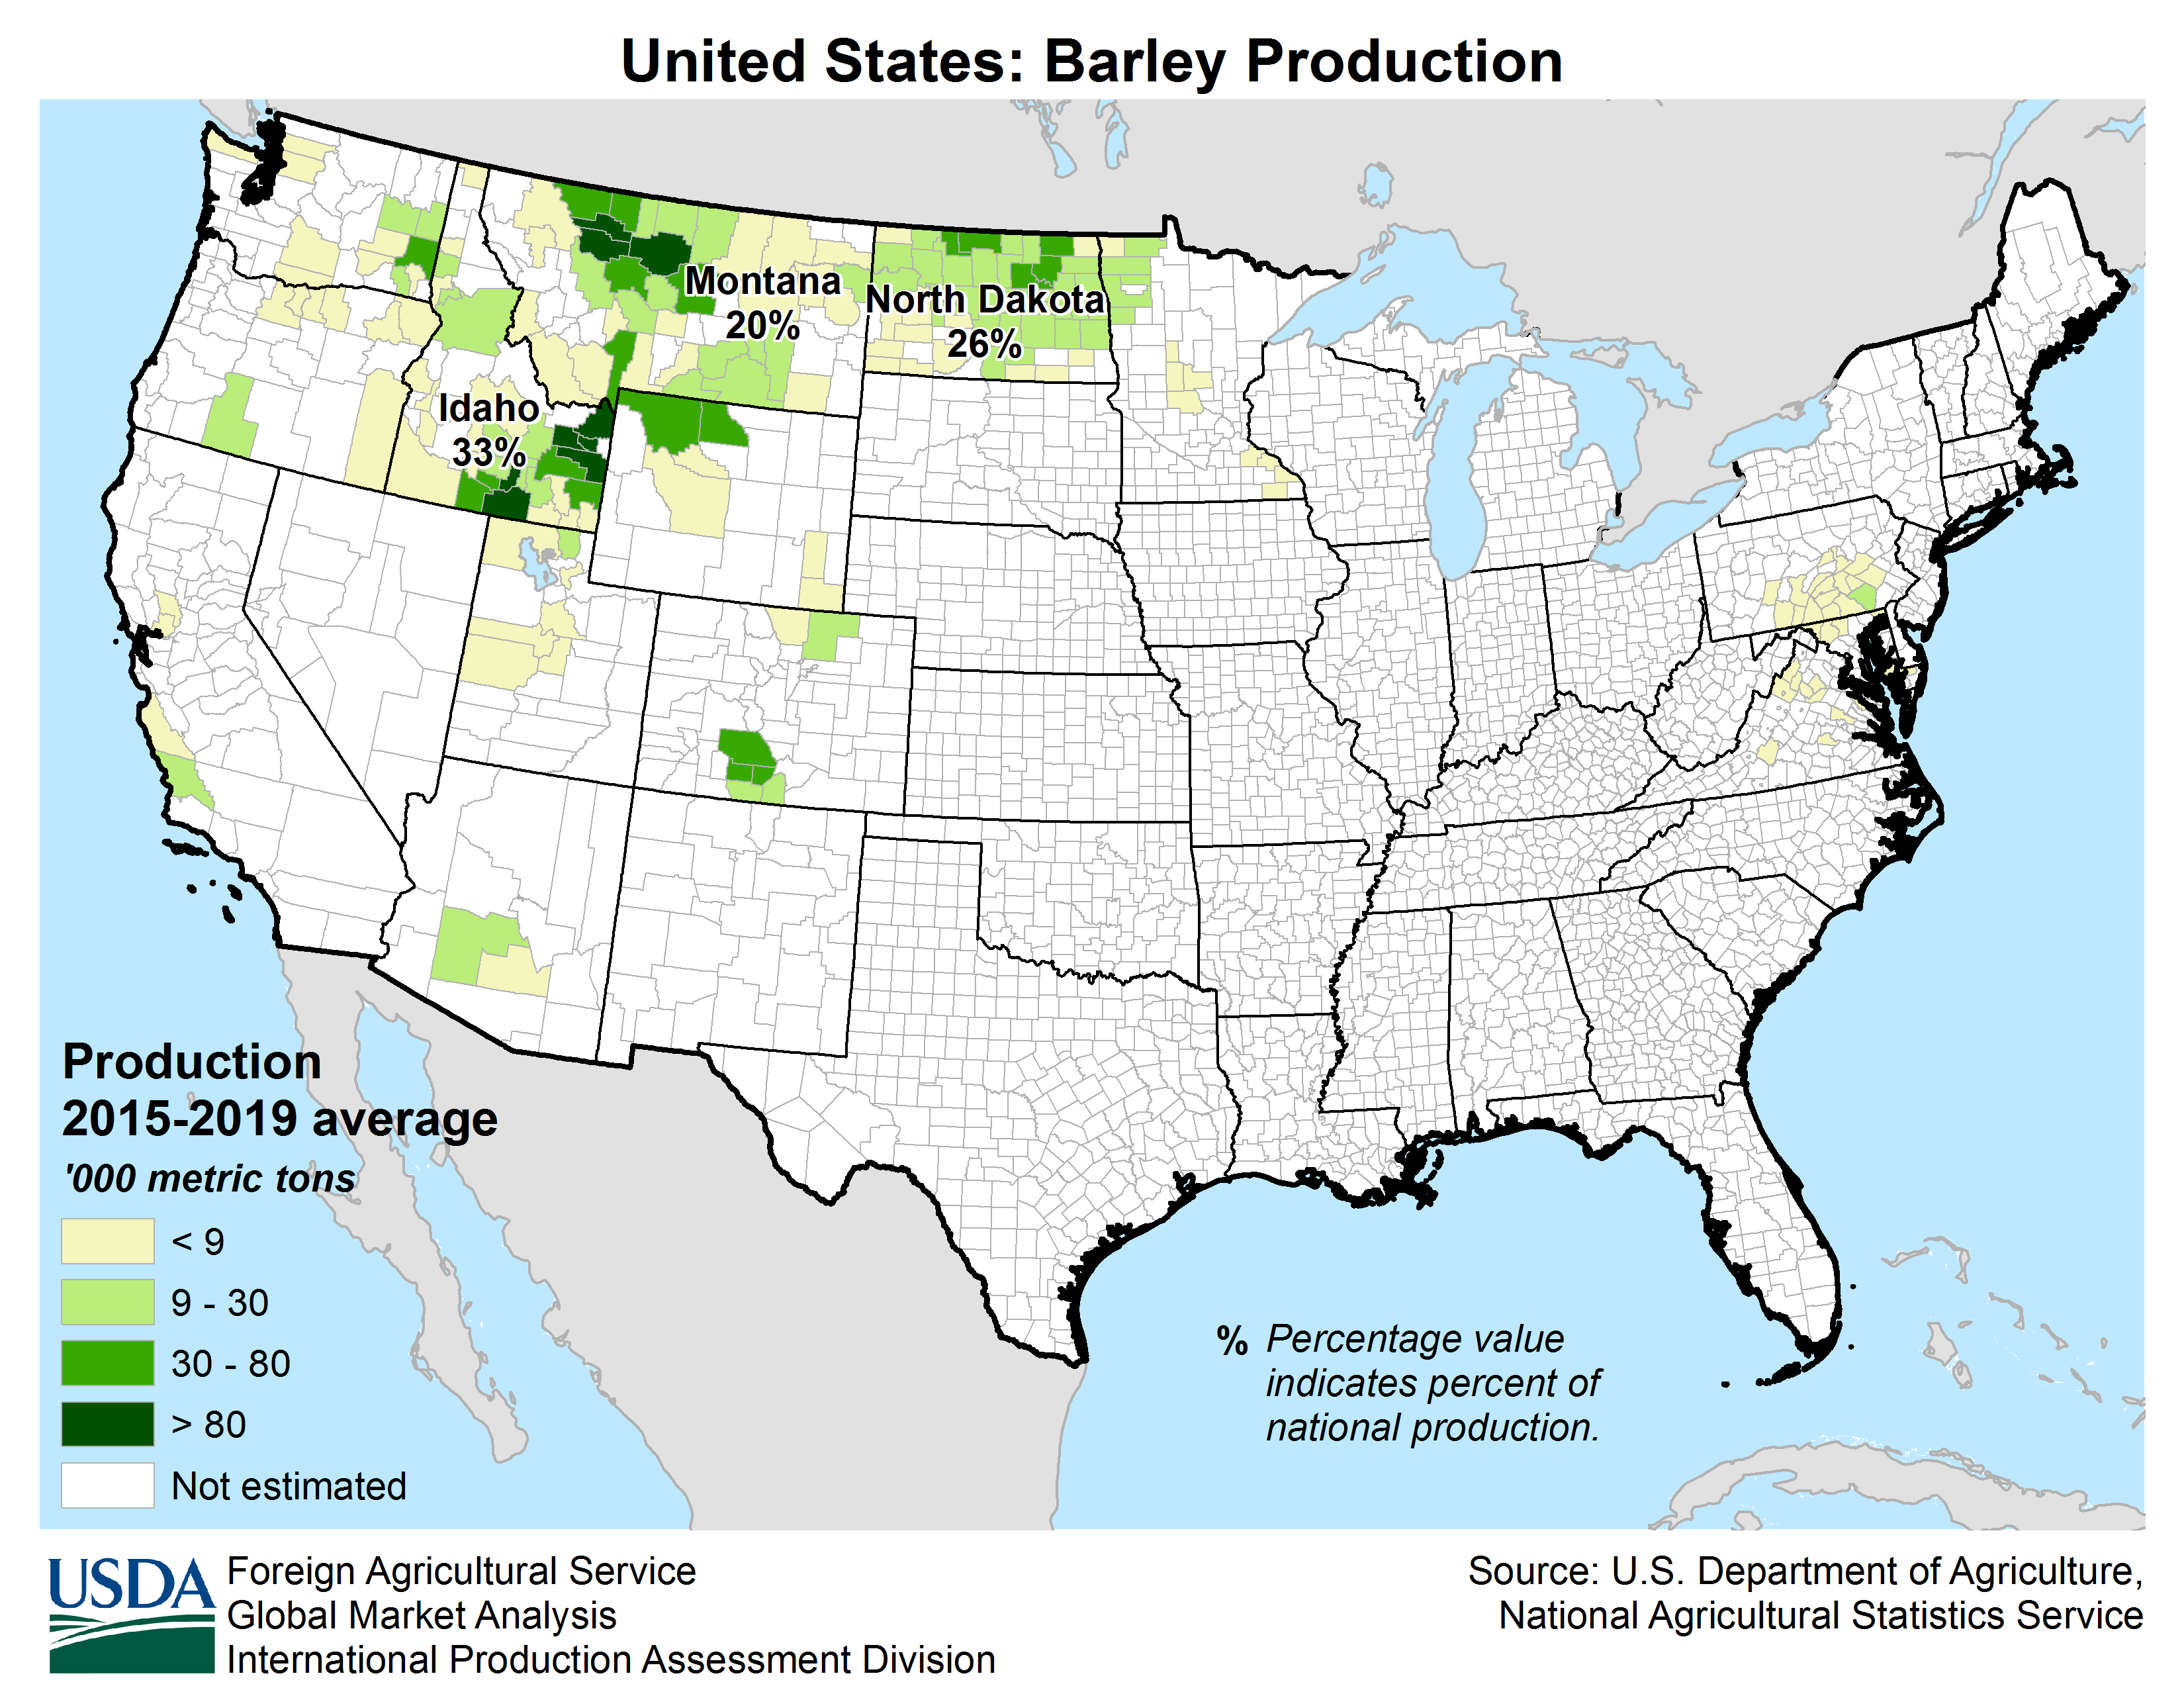 |  |  |
| 10 | Iran | 2 | 3,000 | 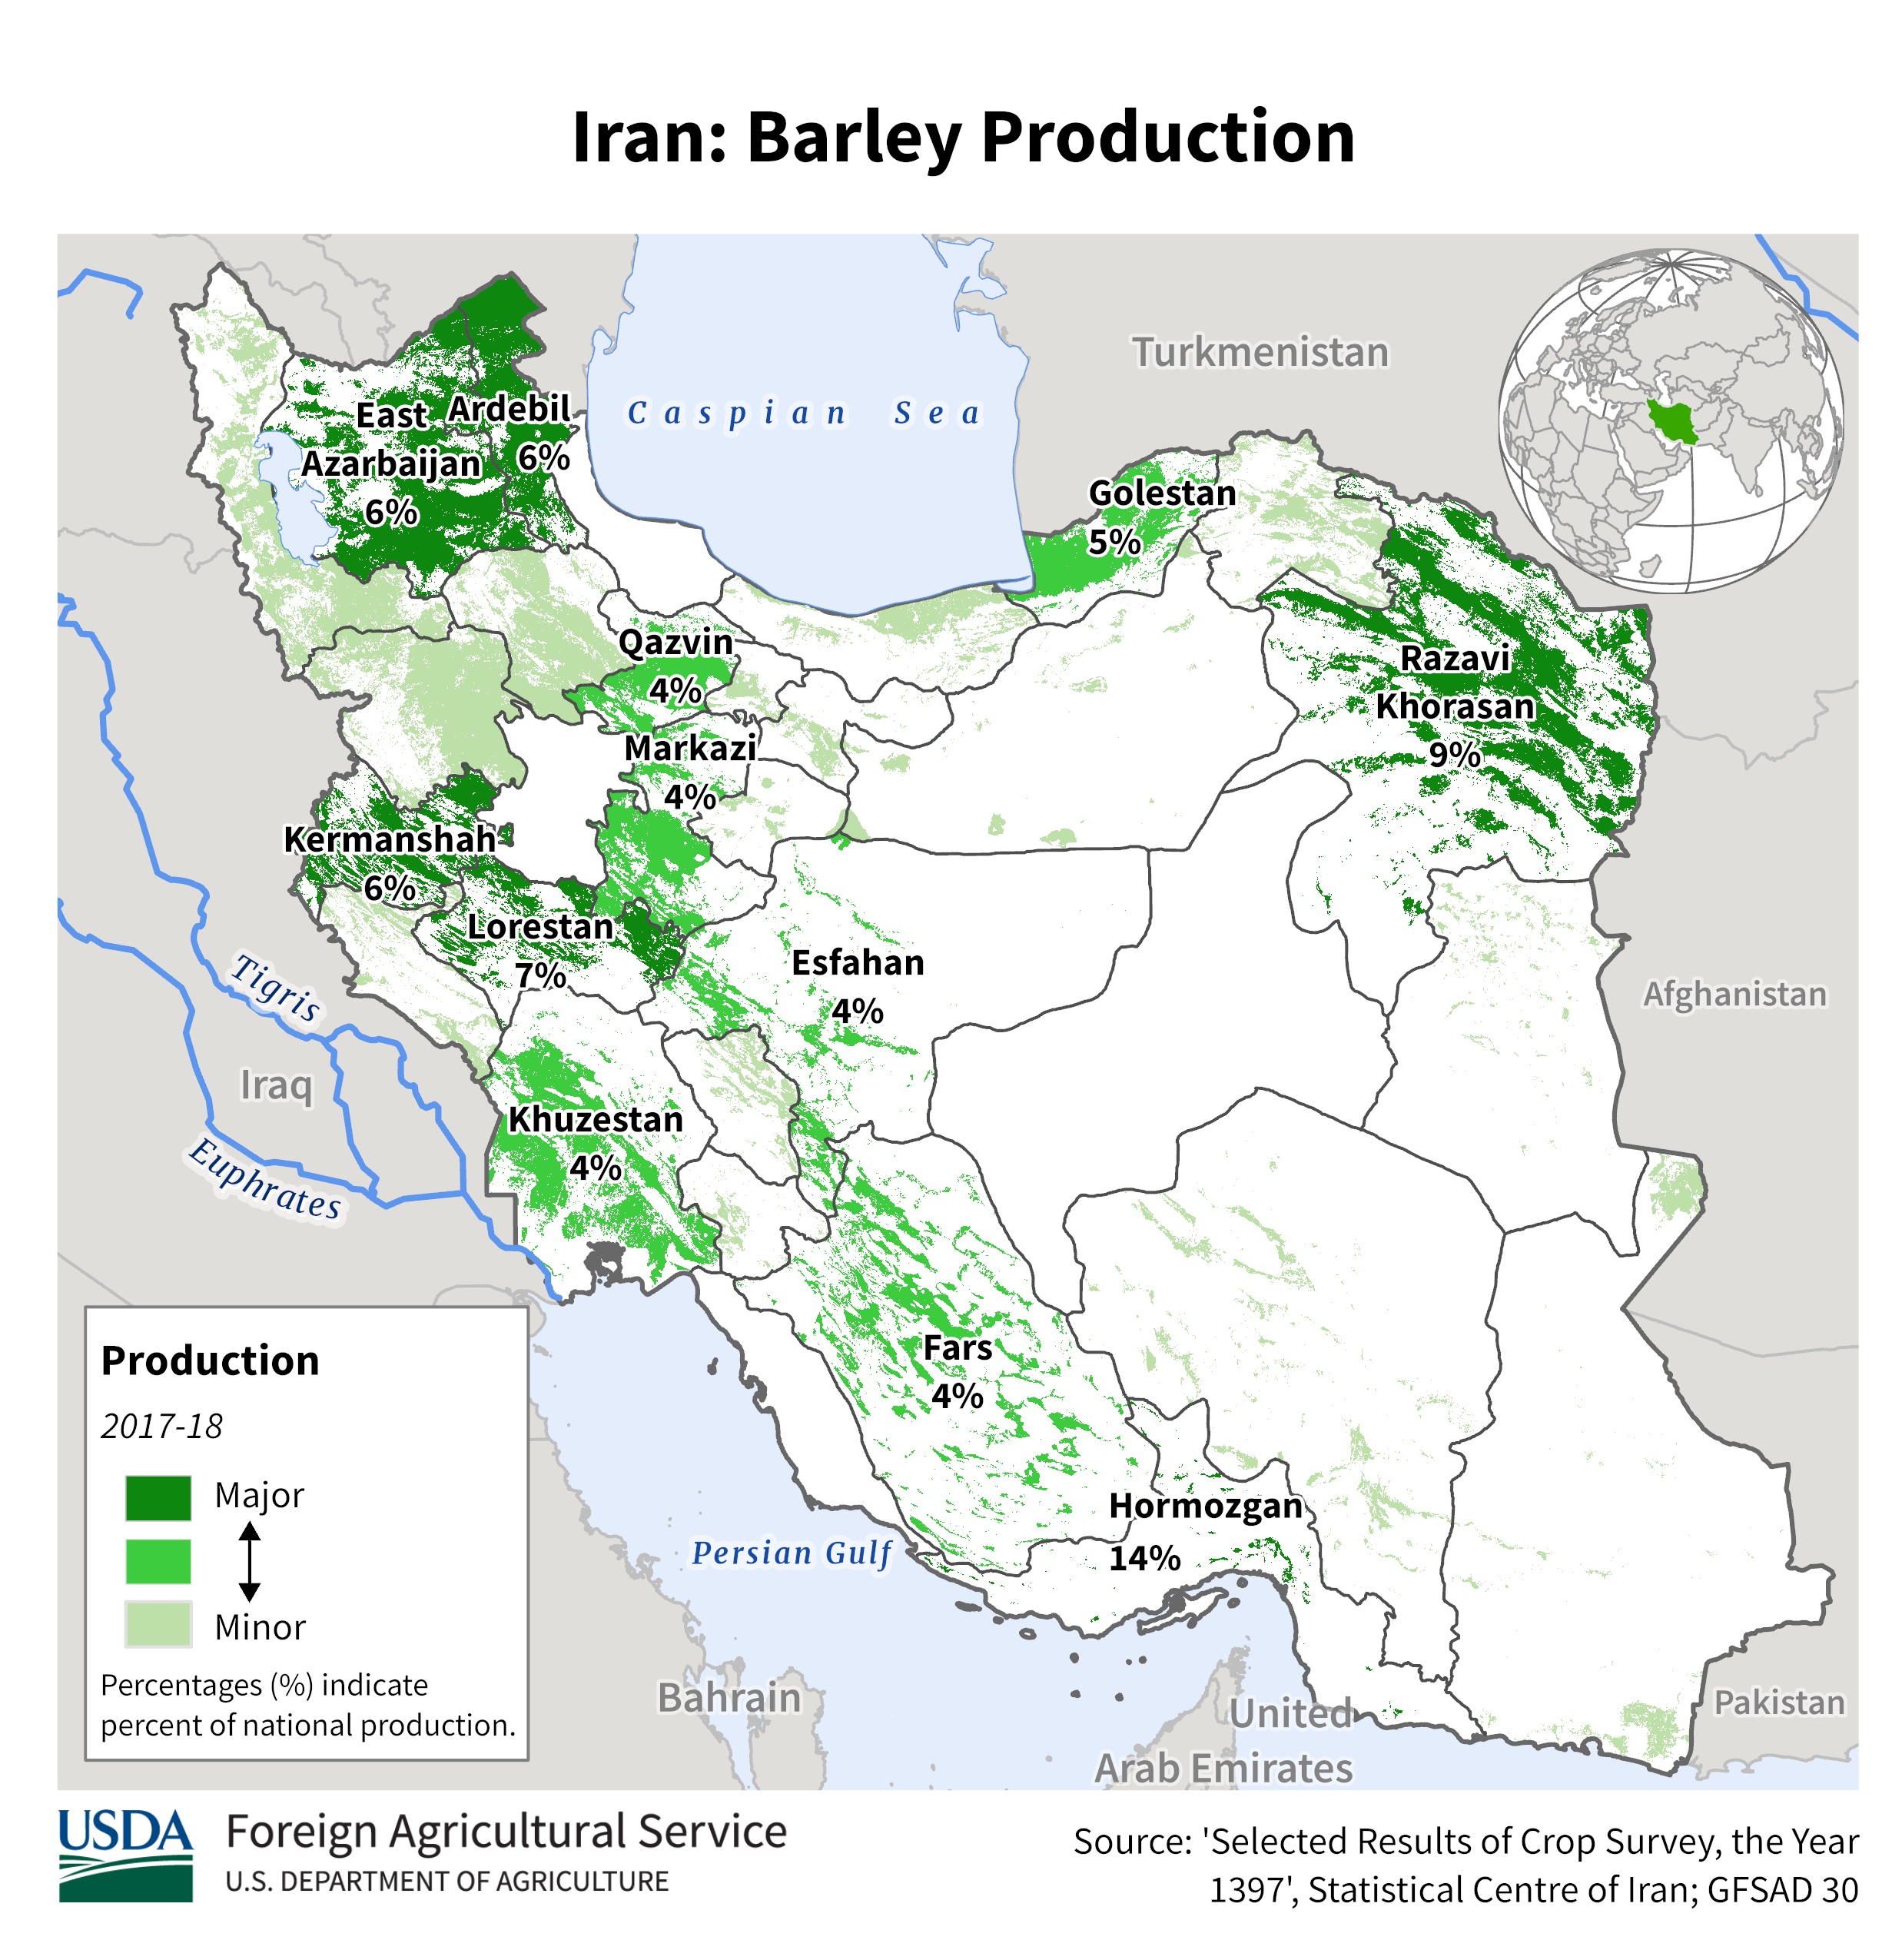 |  |  |
| Next 10 |
Barley Map Explorer
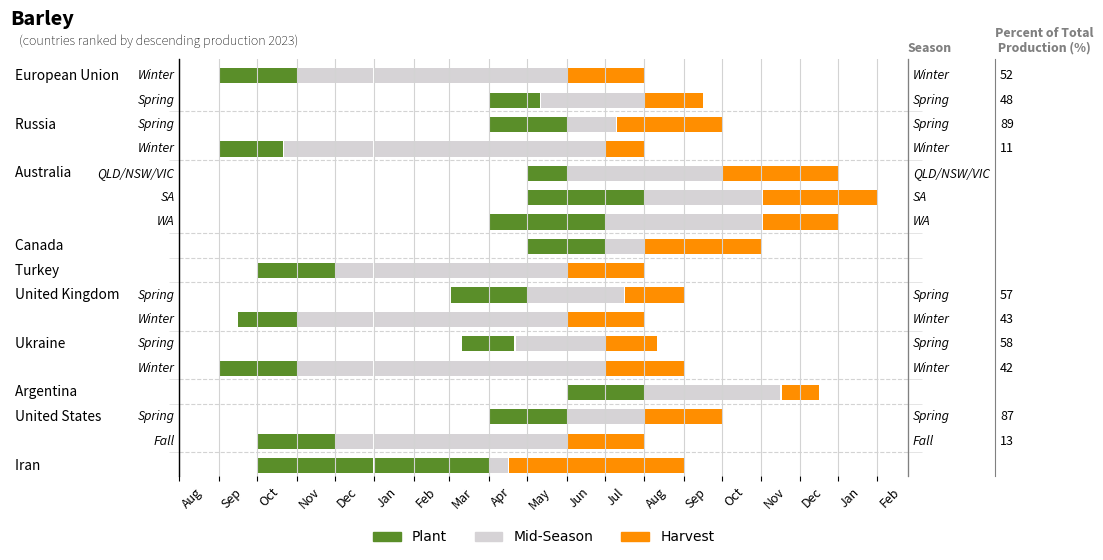
Barley Calendar
*This is Commodity Explorer Version 4.0. All functions are fully implemented for all Commodity Explorers.
*Sub-National production percentages are calculated using IFPRI-SPAM (CY2010) data. These sub-national percentages of total production may differ from the displayed percentages in crop production maps because more recent production data from national ministry of agriculture (MoA) or statistic departments were used in the production maps.